Sioux vs Senegalese Child Poverty Under the Age of 16
COMPARE
Sioux
Senegalese
Child Poverty Under the Age of 16
Child Poverty Under the Age of 16 Comparison
Sioux
Senegalese
25.2%
CHILD POVERTY UNDER THE AGE OF 16
0.0/ 100
METRIC RATING
337th/ 347
METRIC RANK
20.4%
CHILD POVERTY UNDER THE AGE OF 16
0.0/ 100
METRIC RATING
289th/ 347
METRIC RANK
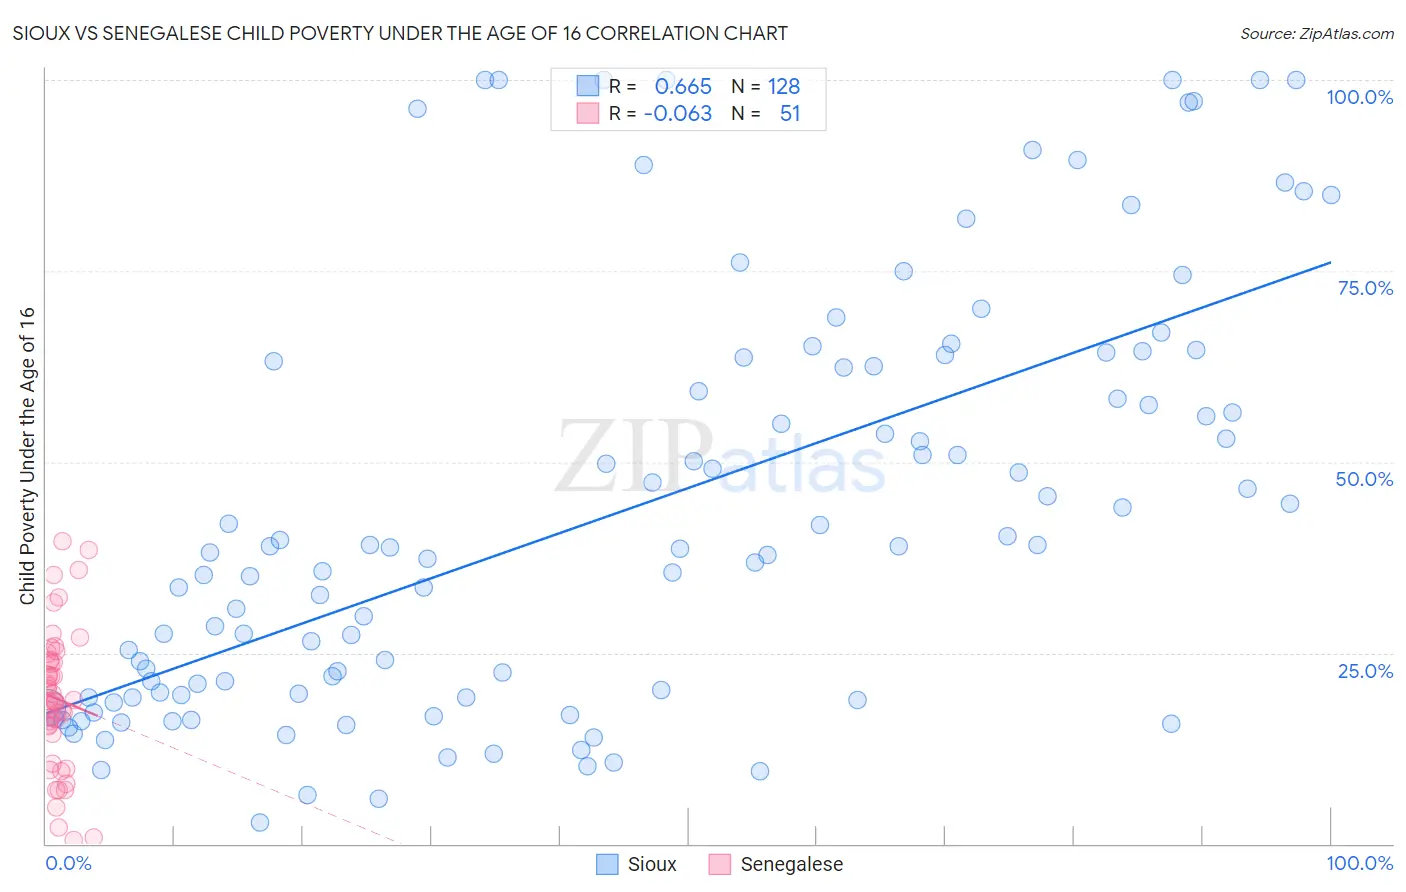
Sioux vs Senegalese Child Poverty Under the Age of 16 Correlation Chart
The statistical analysis conducted on geographies consisting of 233,148,803 people shows a significant positive correlation between the proportion of Sioux and poverty level among children under the age of 16 in the United States with a correlation coefficient (R) of 0.665 and weighted average of 25.2%. Similarly, the statistical analysis conducted on geographies consisting of 78,012,841 people shows a slight negative correlation between the proportion of Senegalese and poverty level among children under the age of 16 in the United States with a correlation coefficient (R) of -0.063 and weighted average of 20.4%, a difference of 23.9%.
Child Poverty Under the Age of 16 Correlation Summary
| Measurement | Sioux | Senegalese |
| Minimum | 2.8% | 0.47% |
| Maximum | 100.0% | 39.6% |
| Range | 97.2% | 39.2% |
| Mean | 43.2% | 19.0% |
| Median | 38.4% | 18.7% |
| Interquartile 25% (IQ1) | 19.3% | 14.3% |
| Interquartile 75% (IQ3) | 62.8% | 24.1% |
| Interquartile Range (IQR) | 43.5% | 9.8% |
| Standard Deviation (Sample) | 27.2% | 9.2% |
| Standard Deviation (Population) | 27.1% | 9.1% |
Similar Demographics by Child Poverty Under the Age of 16
Demographics Similar to Sioux by Child Poverty Under the Age of 16
In terms of child poverty under the age of 16, the demographic groups most similar to Sioux are Yup'ik (25.1%, a difference of 0.37%), Cheyenne (25.4%, a difference of 0.63%), Houma (24.9%, a difference of 1.4%), Crow (26.0%, a difference of 2.9%), and Black/African American (24.4%, a difference of 3.2%).
| Demographics | Rating | Rank | Child Poverty Under the Age of 16 |
| Natives/Alaskans | 0.0 /100 | #330 | Tragic 23.8% |
| Apache | 0.0 /100 | #331 | Tragic 23.8% |
| Pueblo | 0.0 /100 | #332 | Tragic 23.9% |
| Immigrants | Dominican Republic | 0.0 /100 | #333 | Tragic 24.0% |
| Blacks/African Americans | 0.0 /100 | #334 | Tragic 24.4% |
| Houma | 0.0 /100 | #335 | Tragic 24.9% |
| Yup'ik | 0.0 /100 | #336 | Tragic 25.1% |
| Sioux | 0.0 /100 | #337 | Tragic 25.2% |
| Cheyenne | 0.0 /100 | #338 | Tragic 25.4% |
| Crow | 0.0 /100 | #339 | Tragic 26.0% |
| Hopi | 0.0 /100 | #340 | Tragic 27.1% |
| Yuman | 0.0 /100 | #341 | Tragic 28.9% |
| Pima | 0.0 /100 | #342 | Tragic 29.0% |
| Immigrants | Yemen | 0.0 /100 | #343 | Tragic 29.1% |
| Navajo | 0.0 /100 | #344 | Tragic 30.2% |
Demographics Similar to Senegalese by Child Poverty Under the Age of 16
In terms of child poverty under the age of 16, the demographic groups most similar to Senegalese are Yaqui (20.4%, a difference of 0.040%), Immigrants from Belize (20.3%, a difference of 0.24%), Chippewa (20.5%, a difference of 0.78%), Blackfeet (20.2%, a difference of 0.83%), and Immigrants from Latin America (20.5%, a difference of 0.83%).
| Demographics | Rating | Rank | Child Poverty Under the Age of 16 |
| Barbadians | 0.0 /100 | #282 | Tragic 20.0% |
| Immigrants | Zaire | 0.0 /100 | #283 | Tragic 20.1% |
| West Indians | 0.0 /100 | #284 | Tragic 20.1% |
| Immigrants | St. Vincent and the Grenadines | 0.0 /100 | #285 | Tragic 20.1% |
| Immigrants | West Indies | 0.0 /100 | #286 | Tragic 20.2% |
| Blackfeet | 0.0 /100 | #287 | Tragic 20.2% |
| Immigrants | Belize | 0.0 /100 | #288 | Tragic 20.3% |
| Senegalese | 0.0 /100 | #289 | Tragic 20.4% |
| Yaqui | 0.0 /100 | #290 | Tragic 20.4% |
| Chippewa | 0.0 /100 | #291 | Tragic 20.5% |
| Immigrants | Latin America | 0.0 /100 | #292 | Tragic 20.5% |
| Immigrants | Senegal | 0.0 /100 | #293 | Tragic 20.6% |
| Haitians | 0.0 /100 | #294 | Tragic 20.7% |
| Mexicans | 0.0 /100 | #295 | Tragic 20.7% |
| Immigrants | Caribbean | 0.0 /100 | #296 | Tragic 20.8% |