Sierra Leonean vs Syrian Single Male Poverty
COMPARE
Sierra Leonean
Syrian
Single Male Poverty
Single Male Poverty Comparison
Sierra Leoneans
Syrians
12.6%
SINGLE MALE POVERTY
73.0/ 100
METRIC RATING
149th/ 347
METRIC RANK
12.8%
SINGLE MALE POVERTY
48.4/ 100
METRIC RATING
176th/ 347
METRIC RANK
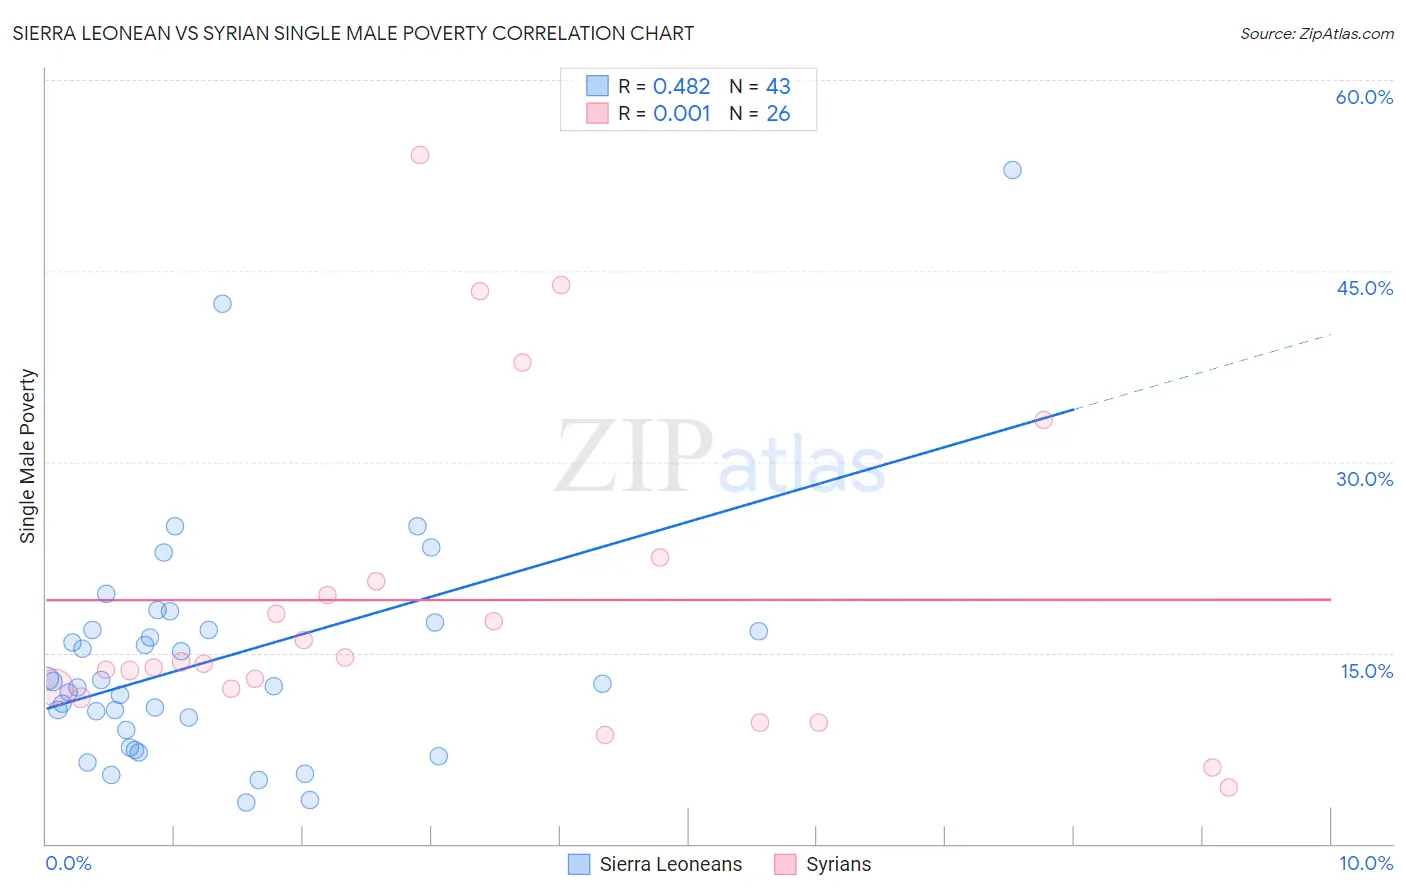
Sierra Leonean vs Syrian Single Male Poverty Correlation Chart
The statistical analysis conducted on geographies consisting of 80,419,123 people shows a moderate positive correlation between the proportion of Sierra Leoneans and poverty level among single males in the United States with a correlation coefficient (R) of 0.482 and weighted average of 12.6%. Similarly, the statistical analysis conducted on geographies consisting of 240,186,917 people shows no correlation between the proportion of Syrians and poverty level among single males in the United States with a correlation coefficient (R) of 0.001 and weighted average of 12.8%, a difference of 1.4%.
Single Male Poverty Correlation Summary
| Measurement | Sierra Leonean | Syrian |
| Minimum | 3.2% | 4.4% |
| Maximum | 52.9% | 54.1% |
| Range | 49.7% | 49.7% |
| Mean | 14.5% | 19.1% |
| Median | 12.5% | 14.2% |
| Interquartile 25% (IQ1) | 8.9% | 12.2% |
| Interquartile 75% (IQ3) | 16.8% | 20.6% |
| Interquartile Range (IQR) | 7.9% | 8.5% |
| Standard Deviation (Sample) | 9.3% | 12.7% |
| Standard Deviation (Population) | 9.2% | 12.5% |
Similar Demographics by Single Male Poverty
Demographics Similar to Sierra Leoneans by Single Male Poverty
In terms of single male poverty, the demographic groups most similar to Sierra Leoneans are Immigrants from Panama (12.6%, a difference of 0.060%), Yugoslavian (12.6%, a difference of 0.070%), Immigrants from Hungary (12.6%, a difference of 0.070%), Australian (12.6%, a difference of 0.11%), and Malaysian (12.6%, a difference of 0.12%).
| Demographics | Rating | Rank | Single Male Poverty |
| Immigrants | Uganda | 75.9 /100 | #142 | Good 12.6% |
| Immigrants | France | 75.8 /100 | #143 | Good 12.6% |
| Hawaiians | 75.1 /100 | #144 | Good 12.6% |
| Immigrants | Lebanon | 75.0 /100 | #145 | Good 12.6% |
| Native Hawaiians | 75.0 /100 | #146 | Good 12.6% |
| Malaysians | 74.8 /100 | #147 | Good 12.6% |
| Yugoslavians | 73.9 /100 | #148 | Good 12.6% |
| Sierra Leoneans | 73.0 /100 | #149 | Good 12.6% |
| Immigrants | Panama | 72.1 /100 | #150 | Good 12.6% |
| Immigrants | Hungary | 71.9 /100 | #151 | Good 12.6% |
| Australians | 71.4 /100 | #152 | Good 12.6% |
| Immigrants | Immigrants | 70.1 /100 | #153 | Good 12.7% |
| Immigrants | Scotland | 68.9 /100 | #154 | Good 12.7% |
| Immigrants | Spain | 68.7 /100 | #155 | Good 12.7% |
| Vietnamese | 67.9 /100 | #156 | Good 12.7% |
Demographics Similar to Syrians by Single Male Poverty
In terms of single male poverty, the demographic groups most similar to Syrians are Croatian (12.8%, a difference of 0.020%), Costa Rican (12.8%, a difference of 0.080%), Immigrants from St. Vincent and the Grenadines (12.8%, a difference of 0.13%), South African (12.8%, a difference of 0.16%), and Danish (12.8%, a difference of 0.16%).
| Demographics | Rating | Rank | Single Male Poverty |
| Puget Sound Salish | 54.3 /100 | #169 | Average 12.8% |
| Guyanese | 52.0 /100 | #170 | Average 12.8% |
| South Africans | 51.5 /100 | #171 | Average 12.8% |
| Danes | 51.4 /100 | #172 | Average 12.8% |
| Immigrants | St. Vincent and the Grenadines | 50.9 /100 | #173 | Average 12.8% |
| Costa Ricans | 50.0 /100 | #174 | Average 12.8% |
| Croatians | 48.9 /100 | #175 | Average 12.8% |
| Syrians | 48.4 /100 | #176 | Average 12.8% |
| Immigrants | Canada | 44.8 /100 | #177 | Average 12.8% |
| Immigrants | Switzerland | 43.1 /100 | #178 | Average 12.8% |
| Israelis | 41.0 /100 | #179 | Average 12.9% |
| Immigrants | North America | 37.7 /100 | #180 | Fair 12.9% |
| Panamanians | 37.6 /100 | #181 | Fair 12.9% |
| Moroccans | 36.8 /100 | #182 | Fair 12.9% |
| Immigrants | West Indies | 33.0 /100 | #183 | Fair 12.9% |