Salvadoran vs Russian Seniors Poverty Over the Age of 75
COMPARE
Salvadoran
Russian
Seniors Poverty Over the Age of 75
Seniors Poverty Over the Age of 75 Comparison
Salvadorans
Russians
14.2%
SENIORS POVERTY OVER THE AGE OF 75
0.0/ 100
METRIC RATING
265th/ 347
METRIC RANK
11.6%
SENIORS POVERTY OVER THE AGE OF 75
89.9/ 100
METRIC RATING
106th/ 347
METRIC RANK
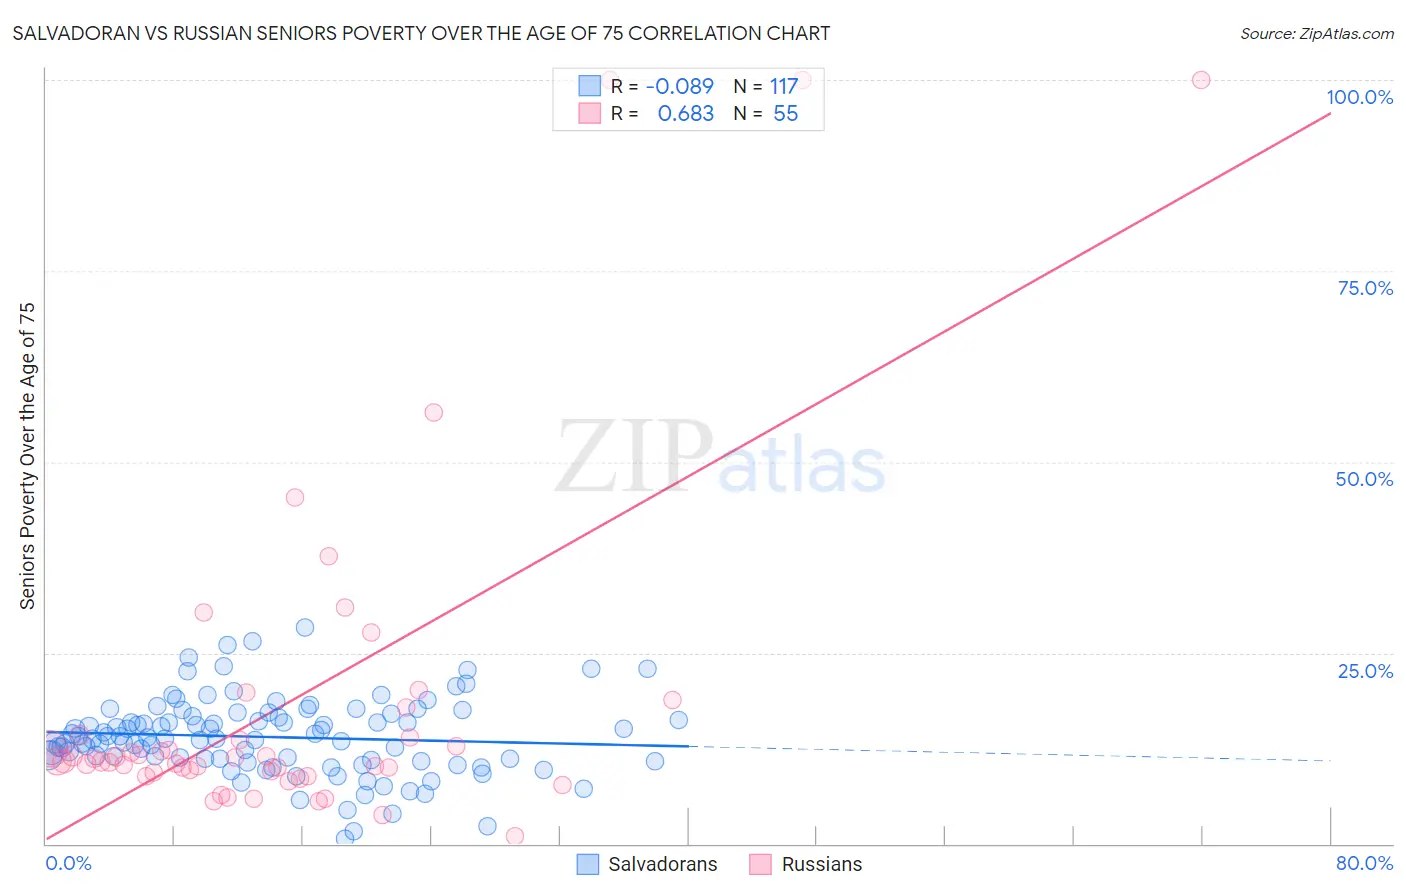
Salvadoran vs Russian Seniors Poverty Over the Age of 75 Correlation Chart
The statistical analysis conducted on geographies consisting of 394,162,125 people shows a slight negative correlation between the proportion of Salvadorans and poverty level among seniors over the age of 75 in the United States with a correlation coefficient (R) of -0.089 and weighted average of 14.2%. Similarly, the statistical analysis conducted on geographies consisting of 501,147,306 people shows a significant positive correlation between the proportion of Russians and poverty level among seniors over the age of 75 in the United States with a correlation coefficient (R) of 0.683 and weighted average of 11.6%, a difference of 21.7%.
Seniors Poverty Over the Age of 75 Correlation Summary
| Measurement | Salvadoran | Russian |
| Minimum | 0.60% | 1.1% |
| Maximum | 28.3% | 100.0% |
| Range | 27.7% | 98.9% |
| Mean | 14.0% | 18.4% |
| Median | 13.8% | 10.8% |
| Interquartile 25% (IQ1) | 11.0% | 9.4% |
| Interquartile 75% (IQ3) | 16.9% | 14.2% |
| Interquartile Range (IQR) | 5.9% | 4.8% |
| Standard Deviation (Sample) | 5.0% | 22.1% |
| Standard Deviation (Population) | 5.0% | 21.9% |
Similar Demographics by Seniors Poverty Over the Age of 75
Demographics Similar to Salvadorans by Seniors Poverty Over the Age of 75
In terms of seniors poverty over the age of 75, the demographic groups most similar to Salvadorans are Armenian (14.2%, a difference of 0.22%), South American (14.1%, a difference of 0.24%), Venezuelan (14.2%, a difference of 0.24%), Colombian (14.3%, a difference of 0.58%), and Immigrants from Venezuela (14.3%, a difference of 0.69%).
| Demographics | Rating | Rank | Seniors Poverty Over the Age of 75 |
| Immigrants | Panama | 0.1 /100 | #258 | Tragic 13.9% |
| Immigrants | Portugal | 0.1 /100 | #259 | Tragic 13.9% |
| Immigrants | Immigrants | 0.1 /100 | #260 | Tragic 13.9% |
| Ghanaians | 0.1 /100 | #261 | Tragic 14.0% |
| Cajuns | 0.1 /100 | #262 | Tragic 14.0% |
| Iroquois | 0.1 /100 | #263 | Tragic 14.0% |
| South Americans | 0.0 /100 | #264 | Tragic 14.1% |
| Salvadorans | 0.0 /100 | #265 | Tragic 14.2% |
| Armenians | 0.0 /100 | #266 | Tragic 14.2% |
| Venezuelans | 0.0 /100 | #267 | Tragic 14.2% |
| Colombians | 0.0 /100 | #268 | Tragic 14.3% |
| Immigrants | Venezuela | 0.0 /100 | #269 | Tragic 14.3% |
| Immigrants | Uruguay | 0.0 /100 | #270 | Tragic 14.3% |
| Immigrants | Ghana | 0.0 /100 | #271 | Tragic 14.4% |
| Mexicans | 0.0 /100 | #272 | Tragic 14.4% |
Demographics Similar to Russians by Seniors Poverty Over the Age of 75
In terms of seniors poverty over the age of 75, the demographic groups most similar to Russians are Chickasaw (11.6%, a difference of 0.080%), Immigrants from Singapore (11.6%, a difference of 0.090%), Immigrants from Oceania (11.7%, a difference of 0.11%), Turkish (11.7%, a difference of 0.12%), and South African (11.7%, a difference of 0.13%).
| Demographics | Rating | Rank | Seniors Poverty Over the Age of 75 |
| Immigrants | Ethiopia | 91.7 /100 | #99 | Exceptional 11.6% |
| Syrians | 91.1 /100 | #100 | Exceptional 11.6% |
| Jordanians | 90.8 /100 | #101 | Exceptional 11.6% |
| Guamanians/Chamorros | 90.6 /100 | #102 | Exceptional 11.6% |
| Immigrants | Kuwait | 90.5 /100 | #103 | Exceptional 11.6% |
| Immigrants | Singapore | 90.3 /100 | #104 | Exceptional 11.6% |
| Chickasaw | 90.2 /100 | #105 | Exceptional 11.6% |
| Russians | 89.9 /100 | #106 | Excellent 11.6% |
| Immigrants | Oceania | 89.4 /100 | #107 | Excellent 11.7% |
| Turks | 89.4 /100 | #108 | Excellent 11.7% |
| South Africans | 89.3 /100 | #109 | Excellent 11.7% |
| Immigrants | Jordan | 88.7 /100 | #110 | Excellent 11.7% |
| Burmese | 88.7 /100 | #111 | Excellent 11.7% |
| Immigrants | Bolivia | 88.4 /100 | #112 | Excellent 11.7% |
| Immigrants | Czechoslovakia | 87.0 /100 | #113 | Excellent 11.7% |