Russian vs Immigrants from Bosnia and Herzegovina Seniors Poverty Over the Age of 75
COMPARE
Russian
Immigrants from Bosnia and Herzegovina
Seniors Poverty Over the Age of 75
Seniors Poverty Over the Age of 75 Comparison
Russians
Immigrants from Bosnia and Herzegovina
11.6%
SENIORS POVERTY OVER THE AGE OF 75
89.9/ 100
METRIC RATING
106th/ 347
METRIC RANK
11.6%
SENIORS POVERTY OVER THE AGE OF 75
92.6/ 100
METRIC RATING
95th/ 347
METRIC RANK
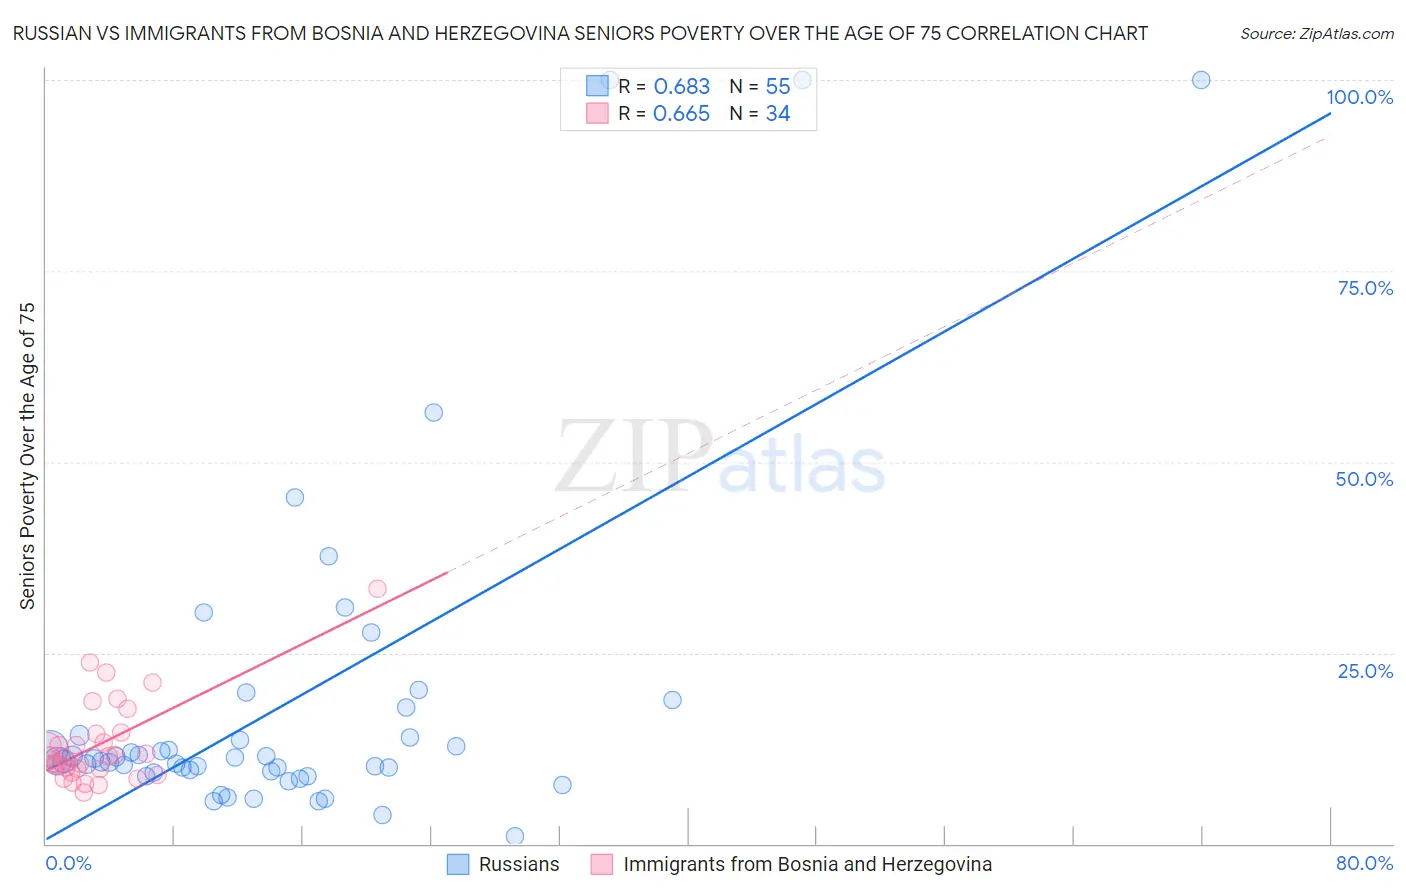
Russian vs Immigrants from Bosnia and Herzegovina Seniors Poverty Over the Age of 75 Correlation Chart
The statistical analysis conducted on geographies consisting of 501,147,306 people shows a significant positive correlation between the proportion of Russians and poverty level among seniors over the age of 75 in the United States with a correlation coefficient (R) of 0.683 and weighted average of 11.6%. Similarly, the statistical analysis conducted on geographies consisting of 156,215,994 people shows a significant positive correlation between the proportion of Immigrants from Bosnia and Herzegovina and poverty level among seniors over the age of 75 in the United States with a correlation coefficient (R) of 0.665 and weighted average of 11.6%, a difference of 0.72%.
Seniors Poverty Over the Age of 75 Correlation Summary
| Measurement | Russian | Immigrants from Bosnia and Herzegovina |
| Minimum | 1.1% | 6.6% |
| Maximum | 100.0% | 33.3% |
| Range | 98.9% | 26.7% |
| Mean | 18.4% | 13.0% |
| Median | 10.8% | 11.4% |
| Interquartile 25% (IQ1) | 9.4% | 9.8% |
| Interquartile 75% (IQ3) | 14.2% | 14.3% |
| Interquartile Range (IQR) | 4.8% | 4.5% |
| Standard Deviation (Sample) | 22.1% | 5.6% |
| Standard Deviation (Population) | 21.9% | 5.5% |
Demographics Similar to Russians and Immigrants from Bosnia and Herzegovina by Seniors Poverty Over the Age of 75
In terms of seniors poverty over the age of 75, the demographic groups most similar to Russians are Chickasaw (11.6%, a difference of 0.080%), Immigrants from Singapore (11.6%, a difference of 0.090%), Immigrants from Oceania (11.7%, a difference of 0.11%), Turkish (11.7%, a difference of 0.12%), and South African (11.7%, a difference of 0.13%). Similarly, the demographic groups most similar to Immigrants from Bosnia and Herzegovina are Immigrants from Sweden (11.6%, a difference of 0.0%), Creek (11.6%, a difference of 0.040%), Romanian (11.6%, a difference of 0.080%), Immigrants from Poland (11.6%, a difference of 0.090%), and Immigrants from Japan (11.6%, a difference of 0.20%).
| Demographics | Rating | Rank | Seniors Poverty Over the Age of 75 |
| Aleuts | 94.1 /100 | #90 | Exceptional 11.5% |
| Immigrants | Germany | 94.1 /100 | #91 | Exceptional 11.5% |
| Kenyans | 93.9 /100 | #92 | Exceptional 11.5% |
| Immigrants | Poland | 92.9 /100 | #93 | Exceptional 11.6% |
| Creek | 92.7 /100 | #94 | Exceptional 11.6% |
| Immigrants | Bosnia and Herzegovina | 92.6 /100 | #95 | Exceptional 11.6% |
| Immigrants | Sweden | 92.6 /100 | #96 | Exceptional 11.6% |
| Romanians | 92.3 /100 | #97 | Exceptional 11.6% |
| Immigrants | Japan | 91.9 /100 | #98 | Exceptional 11.6% |
| Immigrants | Ethiopia | 91.7 /100 | #99 | Exceptional 11.6% |
| Syrians | 91.1 /100 | #100 | Exceptional 11.6% |
| Jordanians | 90.8 /100 | #101 | Exceptional 11.6% |
| Guamanians/Chamorros | 90.6 /100 | #102 | Exceptional 11.6% |
| Immigrants | Kuwait | 90.5 /100 | #103 | Exceptional 11.6% |
| Immigrants | Singapore | 90.3 /100 | #104 | Exceptional 11.6% |
| Chickasaw | 90.2 /100 | #105 | Exceptional 11.6% |
| Russians | 89.9 /100 | #106 | Excellent 11.6% |
| Immigrants | Oceania | 89.4 /100 | #107 | Excellent 11.7% |
| Turks | 89.4 /100 | #108 | Excellent 11.7% |
| South Africans | 89.3 /100 | #109 | Excellent 11.7% |
| Immigrants | Jordan | 88.7 /100 | #110 | Excellent 11.7% |