Puget Sound Salish vs Serbian Seniors Poverty Over the Age of 75
COMPARE
Puget Sound Salish
Serbian
Seniors Poverty Over the Age of 75
Seniors Poverty Over the Age of 75 Comparison
Puget Sound Salish
Serbians
10.8%
SENIORS POVERTY OVER THE AGE OF 75
99.7/ 100
METRIC RATING
33rd/ 347
METRIC RANK
11.1%
SENIORS POVERTY OVER THE AGE OF 75
98.6/ 100
METRIC RATING
50th/ 347
METRIC RANK
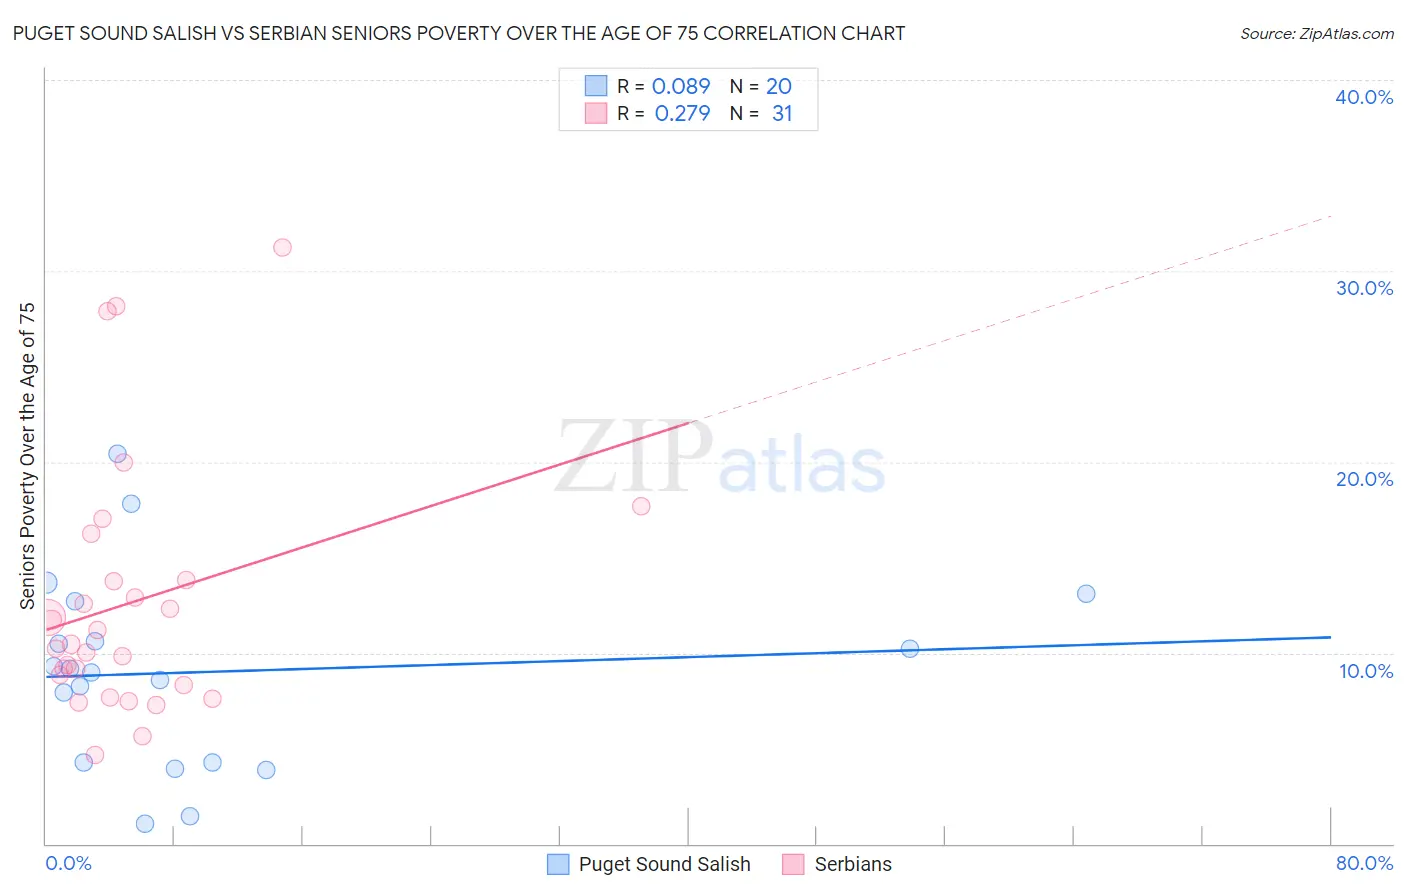
Puget Sound Salish vs Serbian Seniors Poverty Over the Age of 75 Correlation Chart
The statistical analysis conducted on geographies consisting of 45,967,843 people shows a slight positive correlation between the proportion of Puget Sound Salish and poverty level among seniors over the age of 75 in the United States with a correlation coefficient (R) of 0.089 and weighted average of 10.8%. Similarly, the statistical analysis conducted on geographies consisting of 265,638,008 people shows a weak positive correlation between the proportion of Serbians and poverty level among seniors over the age of 75 in the United States with a correlation coefficient (R) of 0.279 and weighted average of 11.1%, a difference of 3.6%.
Seniors Poverty Over the Age of 75 Correlation Summary
| Measurement | Puget Sound Salish | Serbian |
| Minimum | 1.0% | 4.6% |
| Maximum | 20.4% | 31.2% |
| Range | 19.4% | 26.6% |
| Mean | 9.0% | 12.6% |
| Median | 9.1% | 10.4% |
| Interquartile 25% (IQ1) | 4.2% | 8.3% |
| Interquartile 75% (IQ3) | 11.7% | 13.8% |
| Interquartile Range (IQR) | 7.4% | 5.5% |
| Standard Deviation (Sample) | 5.1% | 6.5% |
| Standard Deviation (Population) | 4.9% | 6.4% |
Demographics Similar to Puget Sound Salish and Serbians by Seniors Poverty Over the Age of 75
In terms of seniors poverty over the age of 75, the demographic groups most similar to Puget Sound Salish are Italian (10.8%, a difference of 0.050%), British (10.7%, a difference of 0.060%), Marshallese (10.7%, a difference of 0.19%), Luxembourger (10.8%, a difference of 0.44%), and Scotch-Irish (10.8%, a difference of 0.49%). Similarly, the demographic groups most similar to Serbians are Immigrants from North Macedonia (11.1%, a difference of 0.030%), Samoan (11.1%, a difference of 0.11%), French (11.1%, a difference of 0.22%), Hawaiian (11.1%, a difference of 0.26%), and Greek (11.1%, a difference of 0.70%).
| Demographics | Rating | Rank | Seniors Poverty Over the Age of 75 |
| Marshallese | 99.7 /100 | #31 | Exceptional 10.7% |
| British | 99.7 /100 | #32 | Exceptional 10.7% |
| Puget Sound Salish | 99.7 /100 | #33 | Exceptional 10.8% |
| Italians | 99.7 /100 | #34 | Exceptional 10.8% |
| Luxembourgers | 99.6 /100 | #35 | Exceptional 10.8% |
| Scotch-Irish | 99.6 /100 | #36 | Exceptional 10.8% |
| Latvians | 99.6 /100 | #37 | Exceptional 10.8% |
| Finns | 99.6 /100 | #38 | Exceptional 10.8% |
| Czechoslovakians | 99.4 /100 | #39 | Exceptional 10.9% |
| Thais | 99.4 /100 | #40 | Exceptional 10.9% |
| Immigrants | Lithuania | 99.2 /100 | #41 | Exceptional 11.0% |
| Austrians | 99.1 /100 | #42 | Exceptional 11.0% |
| Celtics | 99.1 /100 | #43 | Exceptional 11.0% |
| Belgians | 99.1 /100 | #44 | Exceptional 11.0% |
| Carpatho Rusyns | 99.0 /100 | #45 | Exceptional 11.1% |
| Greeks | 99.0 /100 | #46 | Exceptional 11.1% |
| Hawaiians | 98.8 /100 | #47 | Exceptional 11.1% |
| French | 98.7 /100 | #48 | Exceptional 11.1% |
| Samoans | 98.7 /100 | #49 | Exceptional 11.1% |
| Serbians | 98.6 /100 | #50 | Exceptional 11.1% |
| Immigrants | North Macedonia | 98.6 /100 | #51 | Exceptional 11.1% |