Puget Sound Salish vs Assyrian/Chaldean/Syriac Seniors Poverty Over the Age of 75
COMPARE
Puget Sound Salish
Assyrian/Chaldean/Syriac
Seniors Poverty Over the Age of 75
Seniors Poverty Over the Age of 75 Comparison
Puget Sound Salish
Assyrians/Chaldeans/Syriacs
10.8%
SENIORS POVERTY OVER THE AGE OF 75
99.7/ 100
METRIC RATING
33rd/ 347
METRIC RANK
10.7%
SENIORS POVERTY OVER THE AGE OF 75
99.8/ 100
METRIC RATING
29th/ 347
METRIC RANK
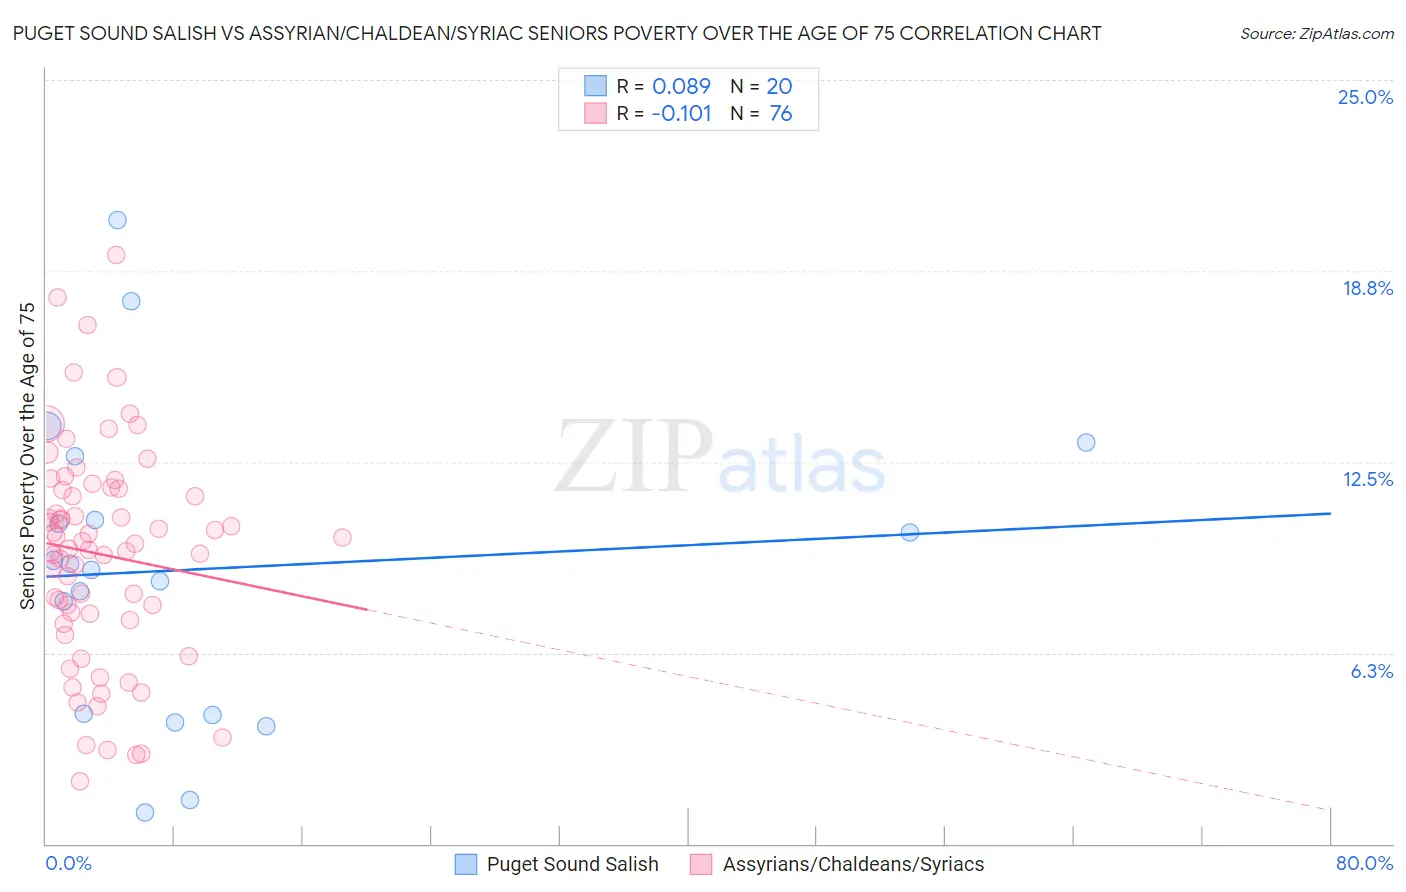
Puget Sound Salish vs Assyrian/Chaldean/Syriac Seniors Poverty Over the Age of 75 Correlation Chart
The statistical analysis conducted on geographies consisting of 45,967,843 people shows a slight positive correlation between the proportion of Puget Sound Salish and poverty level among seniors over the age of 75 in the United States with a correlation coefficient (R) of 0.089 and weighted average of 10.8%. Similarly, the statistical analysis conducted on geographies consisting of 109,878,475 people shows a poor negative correlation between the proportion of Assyrians/Chaldeans/Syriacs and poverty level among seniors over the age of 75 in the United States with a correlation coefficient (R) of -0.101 and weighted average of 10.7%, a difference of 0.46%.
Seniors Poverty Over the Age of 75 Correlation Summary
| Measurement | Puget Sound Salish | Assyrian/Chaldean/Syriac |
| Minimum | 1.0% | 2.1% |
| Maximum | 20.4% | 19.3% |
| Range | 19.4% | 17.2% |
| Mean | 9.0% | 9.5% |
| Median | 9.1% | 9.7% |
| Interquartile 25% (IQ1) | 4.2% | 7.4% |
| Interquartile 75% (IQ3) | 11.7% | 11.6% |
| Interquartile Range (IQR) | 7.4% | 4.2% |
| Standard Deviation (Sample) | 5.1% | 3.5% |
| Standard Deviation (Population) | 4.9% | 3.5% |
Demographics Similar to Puget Sound Salish and Assyrians/Chaldeans/Syriacs by Seniors Poverty Over the Age of 75
In terms of seniors poverty over the age of 75, the demographic groups most similar to Puget Sound Salish are Italian (10.8%, a difference of 0.050%), British (10.7%, a difference of 0.060%), Marshallese (10.7%, a difference of 0.19%), Swiss (10.7%, a difference of 0.38%), and Luxembourger (10.8%, a difference of 0.44%). Similarly, the demographic groups most similar to Assyrians/Chaldeans/Syriacs are Swiss (10.7%, a difference of 0.080%), Irish (10.7%, a difference of 0.15%), Northern European (10.7%, a difference of 0.21%), Marshallese (10.7%, a difference of 0.26%), and British (10.7%, a difference of 0.40%).
| Demographics | Rating | Rank | Seniors Poverty Over the Age of 75 |
| Slovenes | 99.9 /100 | #21 | Exceptional 10.6% |
| Bhutanese | 99.8 /100 | #22 | Exceptional 10.6% |
| Lithuanians | 99.8 /100 | #23 | Exceptional 10.6% |
| Poles | 99.8 /100 | #24 | Exceptional 10.6% |
| Menominee | 99.8 /100 | #25 | Exceptional 10.6% |
| Bulgarians | 99.8 /100 | #26 | Exceptional 10.7% |
| Northern Europeans | 99.8 /100 | #27 | Exceptional 10.7% |
| Irish | 99.8 /100 | #28 | Exceptional 10.7% |
| Assyrians/Chaldeans/Syriacs | 99.8 /100 | #29 | Exceptional 10.7% |
| Swiss | 99.7 /100 | #30 | Exceptional 10.7% |
| Marshallese | 99.7 /100 | #31 | Exceptional 10.7% |
| British | 99.7 /100 | #32 | Exceptional 10.7% |
| Puget Sound Salish | 99.7 /100 | #33 | Exceptional 10.8% |
| Italians | 99.7 /100 | #34 | Exceptional 10.8% |
| Luxembourgers | 99.6 /100 | #35 | Exceptional 10.8% |
| Scotch-Irish | 99.6 /100 | #36 | Exceptional 10.8% |
| Latvians | 99.6 /100 | #37 | Exceptional 10.8% |
| Finns | 99.6 /100 | #38 | Exceptional 10.8% |
| Czechoslovakians | 99.4 /100 | #39 | Exceptional 10.9% |
| Thais | 99.4 /100 | #40 | Exceptional 10.9% |
| Immigrants | Lithuania | 99.2 /100 | #41 | Exceptional 11.0% |