Puerto Rican vs Irish Female Poverty Among 18-24 Year Olds
COMPARE
Puerto Rican
Irish
Female Poverty Among 18-24 Year Olds
Female Poverty Among 18-24 Year Olds Comparison
Puerto Ricans
Irish
29.8%
FEMALE POVERTY AMONG 18-24 YEAR OLDS
0.0/ 100
METRIC RATING
343rd/ 347
METRIC RANK
20.1%
FEMALE POVERTY AMONG 18-24 YEAR OLDS
50.0/ 100
METRIC RATING
173rd/ 347
METRIC RANK
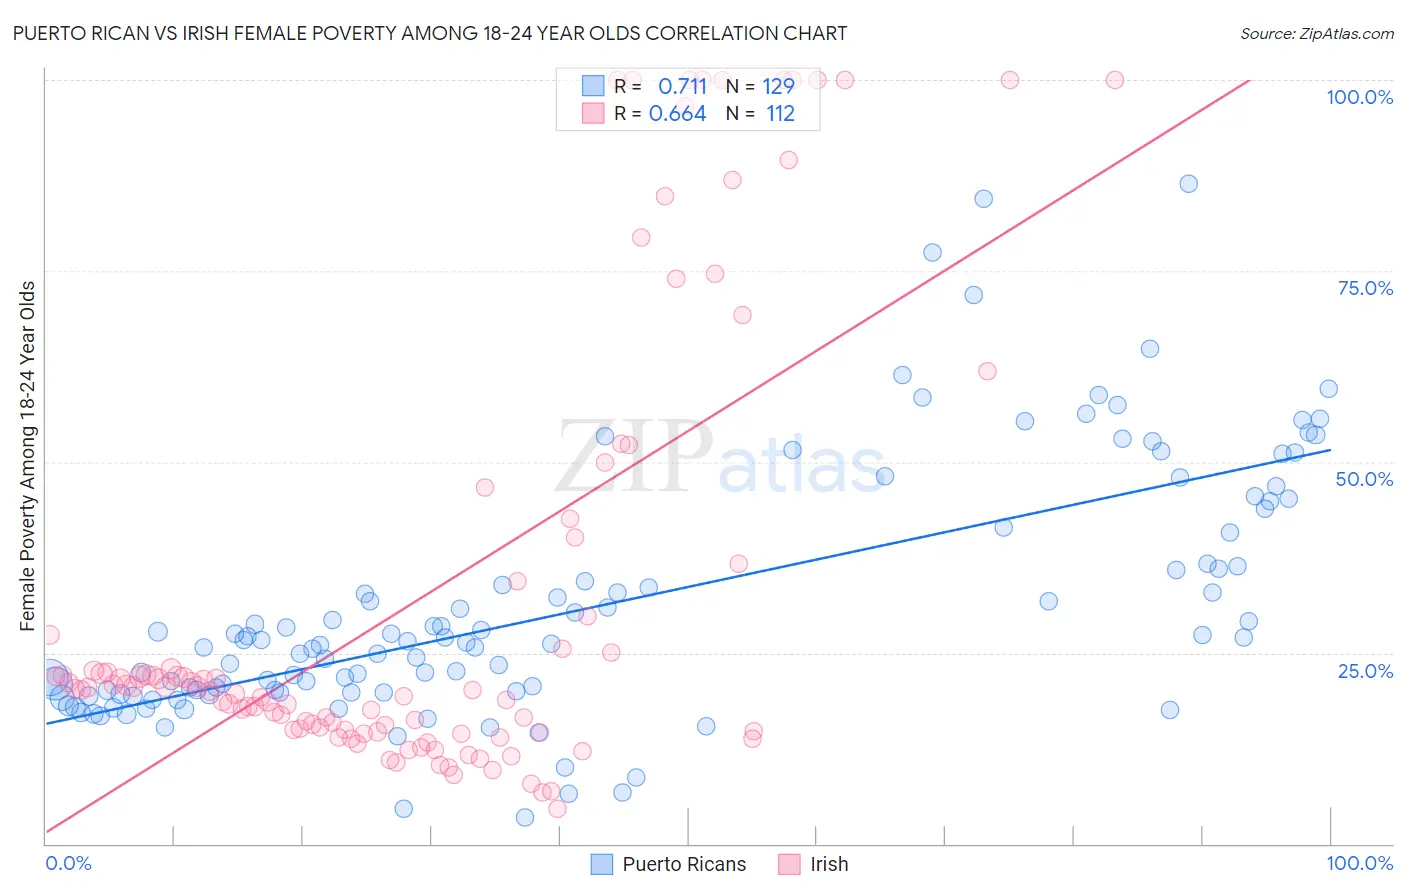
Puerto Rican vs Irish Female Poverty Among 18-24 Year Olds Correlation Chart
The statistical analysis conducted on geographies consisting of 506,051,184 people shows a strong positive correlation between the proportion of Puerto Ricans and poverty level among females between the ages 18 and 24 in the United States with a correlation coefficient (R) of 0.711 and weighted average of 29.8%. Similarly, the statistical analysis conducted on geographies consisting of 542,349,535 people shows a significant positive correlation between the proportion of Irish and poverty level among females between the ages 18 and 24 in the United States with a correlation coefficient (R) of 0.664 and weighted average of 20.1%, a difference of 48.4%.
Female Poverty Among 18-24 Year Olds Correlation Summary
| Measurement | Puerto Rican | Irish |
| Minimum | 3.5% | 4.7% |
| Maximum | 86.4% | 100.0% |
| Range | 82.9% | 95.3% |
| Mean | 31.0% | 32.2% |
| Median | 26.6% | 20.3% |
| Interquartile 25% (IQ1) | 19.8% | 14.8% |
| Interquartile 75% (IQ3) | 38.7% | 32.1% |
| Interquartile Range (IQR) | 18.9% | 17.2% |
| Standard Deviation (Sample) | 16.4% | 29.2% |
| Standard Deviation (Population) | 16.3% | 29.0% |
Similar Demographics by Female Poverty Among 18-24 Year Olds
Demographics Similar to Puerto Ricans by Female Poverty Among 18-24 Year Olds
In terms of female poverty among 18-24 year olds, the demographic groups most similar to Puerto Ricans are Navajo (30.3%, a difference of 1.6%), Kiowa (29.2%, a difference of 2.1%), Colville (29.0%, a difference of 2.8%), Tohono O'odham (31.0%, a difference of 3.9%), and Lumbee (31.1%, a difference of 4.1%).
| Demographics | Rating | Rank | Female Poverty Among 18-24 Year Olds |
| Apache | 0.0 /100 | #333 | Tragic 26.3% |
| Pueblo | 0.0 /100 | #334 | Tragic 26.9% |
| Yup'ik | 0.0 /100 | #335 | Tragic 27.0% |
| Immigrants | Yemen | 0.0 /100 | #336 | Tragic 27.5% |
| Cheyenne | 0.0 /100 | #337 | Tragic 28.1% |
| Hopi | 0.0 /100 | #338 | Tragic 28.2% |
| Pima | 0.0 /100 | #339 | Tragic 28.4% |
| Sioux | 0.0 /100 | #340 | Tragic 28.6% |
| Colville | 0.0 /100 | #341 | Tragic 29.0% |
| Kiowa | 0.0 /100 | #342 | Tragic 29.2% |
| Puerto Ricans | 0.0 /100 | #343 | Tragic 29.8% |
| Navajo | 0.0 /100 | #344 | Tragic 30.3% |
| Tohono O'odham | 0.0 /100 | #345 | Tragic 31.0% |
| Lumbee | 0.0 /100 | #346 | Tragic 31.1% |
| Crow | 0.0 /100 | #347 | Tragic 33.2% |
Demographics Similar to Irish by Female Poverty Among 18-24 Year Olds
In terms of female poverty among 18-24 year olds, the demographic groups most similar to Irish are Swedish (20.1%, a difference of 0.0%), South American Indian (20.1%, a difference of 0.080%), Belizean (20.1%, a difference of 0.10%), Immigrants from Nigeria (20.1%, a difference of 0.21%), and Iranian (20.1%, a difference of 0.23%).
| Demographics | Rating | Rank | Female Poverty Among 18-24 Year Olds |
| Belgians | 69.1 /100 | #166 | Good 19.9% |
| Czechoslovakians | 61.8 /100 | #167 | Good 20.0% |
| Fijians | 59.1 /100 | #168 | Average 20.0% |
| Hmong | 55.4 /100 | #169 | Average 20.0% |
| Iranians | 54.7 /100 | #170 | Average 20.1% |
| Immigrants | Nigeria | 54.3 /100 | #171 | Average 20.1% |
| Belizeans | 52.0 /100 | #172 | Average 20.1% |
| Irish | 50.0 /100 | #173 | Average 20.1% |
| Swedes | 50.0 /100 | #174 | Average 20.1% |
| South American Indians | 48.4 /100 | #175 | Average 20.1% |
| Kenyans | 44.9 /100 | #176 | Average 20.2% |
| Immigrants | Kazakhstan | 44.2 /100 | #177 | Average 20.2% |
| Swiss | 44.0 /100 | #178 | Average 20.2% |
| Ethiopians | 43.8 /100 | #179 | Average 20.2% |
| Iraqis | 43.3 /100 | #180 | Average 20.2% |