Polish vs Korean Single Male Poverty
COMPARE
Polish
Korean
Single Male Poverty
Single Male Poverty Comparison
Poles
Koreans
13.0%
SINGLE MALE POVERTY
19.3/ 100
METRIC RATING
205th/ 347
METRIC RANK
11.0%
SINGLE MALE POVERTY
100.0/ 100
METRIC RATING
15th/ 347
METRIC RANK
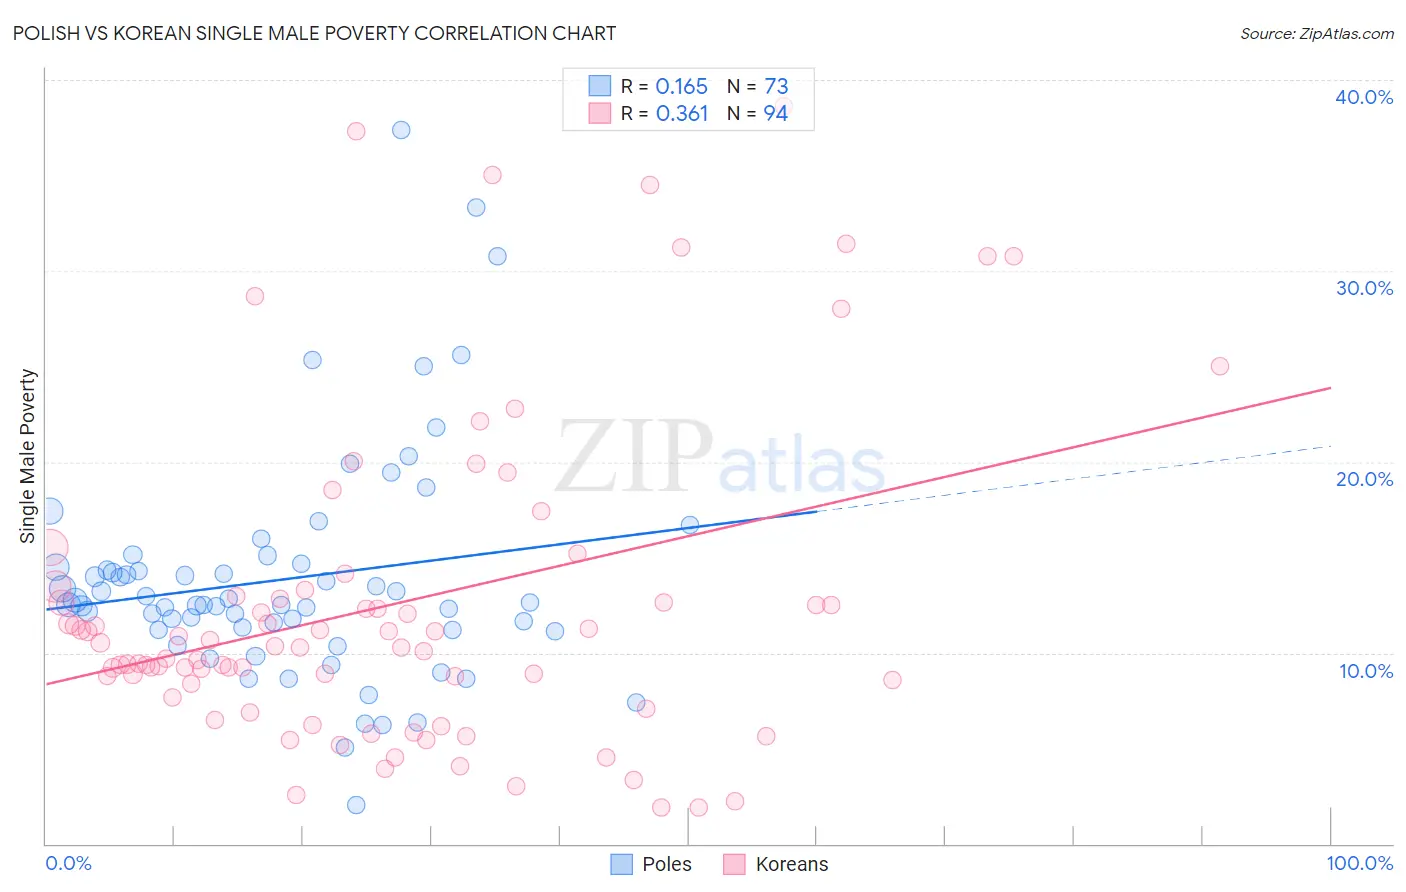
Polish vs Korean Single Male Poverty Correlation Chart
The statistical analysis conducted on geographies consisting of 463,988,373 people shows a poor positive correlation between the proportion of Poles and poverty level among single males in the United States with a correlation coefficient (R) of 0.165 and weighted average of 13.0%. Similarly, the statistical analysis conducted on geographies consisting of 437,940,785 people shows a mild positive correlation between the proportion of Koreans and poverty level among single males in the United States with a correlation coefficient (R) of 0.361 and weighted average of 11.0%, a difference of 18.7%.
Single Male Poverty Correlation Summary
| Measurement | Polish | Korean |
| Minimum | 2.0% | 1.9% |
| Maximum | 37.4% | 38.6% |
| Range | 35.4% | 36.8% |
| Mean | 13.9% | 12.5% |
| Median | 12.5% | 10.3% |
| Interquartile 25% (IQ1) | 11.2% | 8.4% |
| Interquartile 75% (IQ3) | 14.6% | 13.0% |
| Interquartile Range (IQR) | 3.4% | 4.6% |
| Standard Deviation (Sample) | 6.0% | 8.3% |
| Standard Deviation (Population) | 6.0% | 8.3% |
Similar Demographics by Single Male Poverty
Demographics Similar to Poles by Single Male Poverty
In terms of single male poverty, the demographic groups most similar to Poles are Northern European (13.0%, a difference of 0.040%), Estonian (13.0%, a difference of 0.080%), Immigrants from Bangladesh (13.0%, a difference of 0.090%), Basque (13.0%, a difference of 0.11%), and Sudanese (13.1%, a difference of 0.14%).
| Demographics | Rating | Rank | Single Male Poverty |
| Lithuanians | 22.1 /100 | #198 | Fair 13.0% |
| Immigrants | Norway | 21.8 /100 | #199 | Fair 13.0% |
| Slovenes | 21.6 /100 | #200 | Fair 13.0% |
| Trinidadians and Tobagonians | 21.4 /100 | #201 | Fair 13.0% |
| Basques | 20.7 /100 | #202 | Fair 13.0% |
| Immigrants | Bangladesh | 20.4 /100 | #203 | Fair 13.0% |
| Estonians | 20.3 /100 | #204 | Fair 13.0% |
| Poles | 19.3 /100 | #205 | Poor 13.0% |
| Northern Europeans | 18.9 /100 | #206 | Poor 13.0% |
| Sudanese | 17.7 /100 | #207 | Poor 13.1% |
| Immigrants | Western Africa | 17.6 /100 | #208 | Poor 13.1% |
| Mexican American Indians | 17.5 /100 | #209 | Poor 13.1% |
| Immigrants | Haiti | 16.8 /100 | #210 | Poor 13.1% |
| Swedes | 16.8 /100 | #211 | Poor 13.1% |
| Senegalese | 16.4 /100 | #212 | Poor 13.1% |
Demographics Similar to Koreans by Single Male Poverty
In terms of single male poverty, the demographic groups most similar to Koreans are Chinese (11.0%, a difference of 0.050%), Immigrants from South Central Asia (10.9%, a difference of 0.62%), Immigrants from Afghanistan (10.9%, a difference of 0.74%), Bhutanese (11.1%, a difference of 0.75%), and Immigrants from Philippines (10.9%, a difference of 0.82%).
| Demographics | Rating | Rank | Single Male Poverty |
| Thais | 100.0 /100 | #8 | Exceptional 10.8% |
| Taiwanese | 100.0 /100 | #9 | Exceptional 10.9% |
| Immigrants | Fiji | 100.0 /100 | #10 | Exceptional 10.9% |
| Immigrants | Philippines | 100.0 /100 | #11 | Exceptional 10.9% |
| Immigrants | Afghanistan | 100.0 /100 | #12 | Exceptional 10.9% |
| Immigrants | South Central Asia | 100.0 /100 | #13 | Exceptional 10.9% |
| Chinese | 100.0 /100 | #14 | Exceptional 11.0% |
| Koreans | 100.0 /100 | #15 | Exceptional 11.0% |
| Bhutanese | 100.0 /100 | #16 | Exceptional 11.1% |
| Tsimshian | 100.0 /100 | #17 | Exceptional 11.1% |
| Immigrants | Bolivia | 100.0 /100 | #18 | Exceptional 11.1% |
| Immigrants | Moldova | 100.0 /100 | #19 | Exceptional 11.2% |
| Ethiopians | 100.0 /100 | #20 | Exceptional 11.2% |
| Asians | 100.0 /100 | #21 | Exceptional 11.2% |
| Immigrants | Pakistan | 100.0 /100 | #22 | Exceptional 11.2% |