Pennsylvania German vs Taiwanese Female Poverty Among 18-24 Year Olds
COMPARE
Pennsylvania German
Taiwanese
Female Poverty Among 18-24 Year Olds
Female Poverty Among 18-24 Year Olds Comparison
Pennsylvania Germans
Taiwanese
19.7%
FEMALE POVERTY AMONG 18-24 YEAR OLDS
85.5/ 100
METRIC RATING
141st/ 347
METRIC RANK
21.2%
FEMALE POVERTY AMONG 18-24 YEAR OLDS
1.0/ 100
METRIC RATING
257th/ 347
METRIC RANK
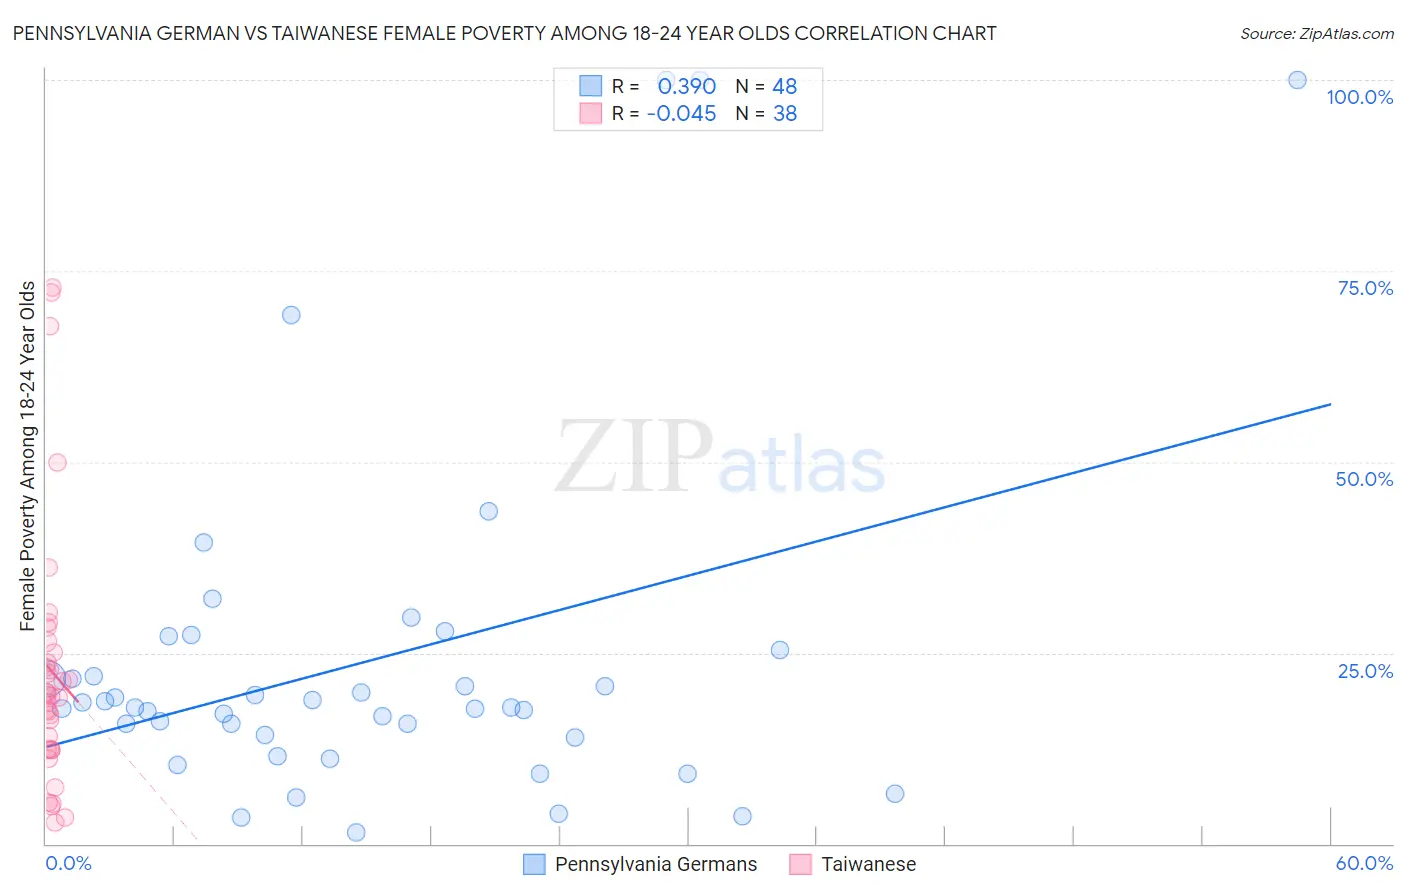
Pennsylvania German vs Taiwanese Female Poverty Among 18-24 Year Olds Correlation Chart
The statistical analysis conducted on geographies consisting of 228,021,378 people shows a mild positive correlation between the proportion of Pennsylvania Germans and poverty level among females between the ages 18 and 24 in the United States with a correlation coefficient (R) of 0.390 and weighted average of 19.7%. Similarly, the statistical analysis conducted on geographies consisting of 31,675,814 people shows no correlation between the proportion of Taiwanese and poverty level among females between the ages 18 and 24 in the United States with a correlation coefficient (R) of -0.045 and weighted average of 21.2%, a difference of 8.0%.
Female Poverty Among 18-24 Year Olds Correlation Summary
| Measurement | Pennsylvania German | Taiwanese |
| Minimum | 1.4% | 2.8% |
| Maximum | 100.0% | 72.8% |
| Range | 98.6% | 69.9% |
| Mean | 23.9% | 22.6% |
| Median | 17.8% | 19.4% |
| Interquartile 25% (IQ1) | 14.0% | 12.3% |
| Interquartile 75% (IQ3) | 23.7% | 25.0% |
| Interquartile Range (IQR) | 9.6% | 12.7% |
| Standard Deviation (Sample) | 22.8% | 17.1% |
| Standard Deviation (Population) | 22.6% | 16.9% |
Similar Demographics by Female Poverty Among 18-24 Year Olds
Demographics Similar to Pennsylvania Germans by Female Poverty Among 18-24 Year Olds
In terms of female poverty among 18-24 year olds, the demographic groups most similar to Pennsylvania Germans are Immigrants from Trinidad and Tobago (19.7%, a difference of 0.010%), Panamanian (19.7%, a difference of 0.090%), Slavic (19.7%, a difference of 0.11%), Immigrants from Northern Africa (19.7%, a difference of 0.14%), and Canadian (19.7%, a difference of 0.17%).
| Demographics | Rating | Rank | Female Poverty Among 18-24 Year Olds |
| Immigrants | North America | 92.1 /100 | #134 | Exceptional 19.5% |
| Soviet Union | 92.0 /100 | #135 | Exceptional 19.5% |
| Russians | 91.5 /100 | #136 | Exceptional 19.5% |
| Austrians | 90.7 /100 | #137 | Exceptional 19.5% |
| Immigrants | Morocco | 89.9 /100 | #138 | Excellent 19.6% |
| Indians (Asian) | 88.3 /100 | #139 | Excellent 19.6% |
| Immigrants | Trinidad and Tobago | 85.6 /100 | #140 | Excellent 19.7% |
| Pennsylvania Germans | 85.5 /100 | #141 | Excellent 19.7% |
| Panamanians | 84.6 /100 | #142 | Excellent 19.7% |
| Slavs | 84.4 /100 | #143 | Excellent 19.7% |
| Immigrants | Northern Africa | 84.1 /100 | #144 | Excellent 19.7% |
| Canadians | 83.8 /100 | #145 | Excellent 19.7% |
| Immigrants | Bosnia and Herzegovina | 83.6 /100 | #146 | Excellent 19.7% |
| Immigrants | Austria | 83.1 /100 | #147 | Excellent 19.7% |
| Immigrants | Latin America | 81.3 /100 | #148 | Excellent 19.7% |
Demographics Similar to Taiwanese by Female Poverty Among 18-24 Year Olds
In terms of female poverty among 18-24 year olds, the demographic groups most similar to Taiwanese are Tsimshian (21.2%, a difference of 0.10%), Immigrants from Grenada (21.2%, a difference of 0.26%), British West Indian (21.2%, a difference of 0.29%), Vietnamese (21.4%, a difference of 0.54%), and Immigrants from France (21.4%, a difference of 0.57%).
| Demographics | Rating | Rank | Female Poverty Among 18-24 Year Olds |
| Immigrants | West Indies | 2.2 /100 | #250 | Tragic 21.0% |
| West Indians | 1.9 /100 | #251 | Tragic 21.1% |
| South Africans | 1.6 /100 | #252 | Tragic 21.1% |
| Delaware | 1.6 /100 | #253 | Tragic 21.1% |
| British West Indians | 1.2 /100 | #254 | Tragic 21.2% |
| Immigrants | Grenada | 1.2 /100 | #255 | Tragic 21.2% |
| Tsimshian | 1.0 /100 | #256 | Tragic 21.2% |
| Taiwanese | 1.0 /100 | #257 | Tragic 21.2% |
| Vietnamese | 0.6 /100 | #258 | Tragic 21.4% |
| Immigrants | France | 0.6 /100 | #259 | Tragic 21.4% |
| Immigrants | Norway | 0.6 /100 | #260 | Tragic 21.4% |
| Immigrants | Bahamas | 0.5 /100 | #261 | Tragic 21.4% |
| Immigrants | Eastern Africa | 0.4 /100 | #262 | Tragic 21.4% |
| Icelanders | 0.3 /100 | #263 | Tragic 21.5% |
| Hondurans | 0.3 /100 | #264 | Tragic 21.5% |