Basque vs Taiwanese Female Poverty Among 18-24 Year Olds
COMPARE
Basque
Taiwanese
Female Poverty Among 18-24 Year Olds
Female Poverty Among 18-24 Year Olds Comparison
Basques
Taiwanese
21.7%
FEMALE POVERTY AMONG 18-24 YEAR OLDS
0.2/ 100
METRIC RATING
272nd/ 347
METRIC RANK
21.2%
FEMALE POVERTY AMONG 18-24 YEAR OLDS
1.0/ 100
METRIC RATING
257th/ 347
METRIC RANK
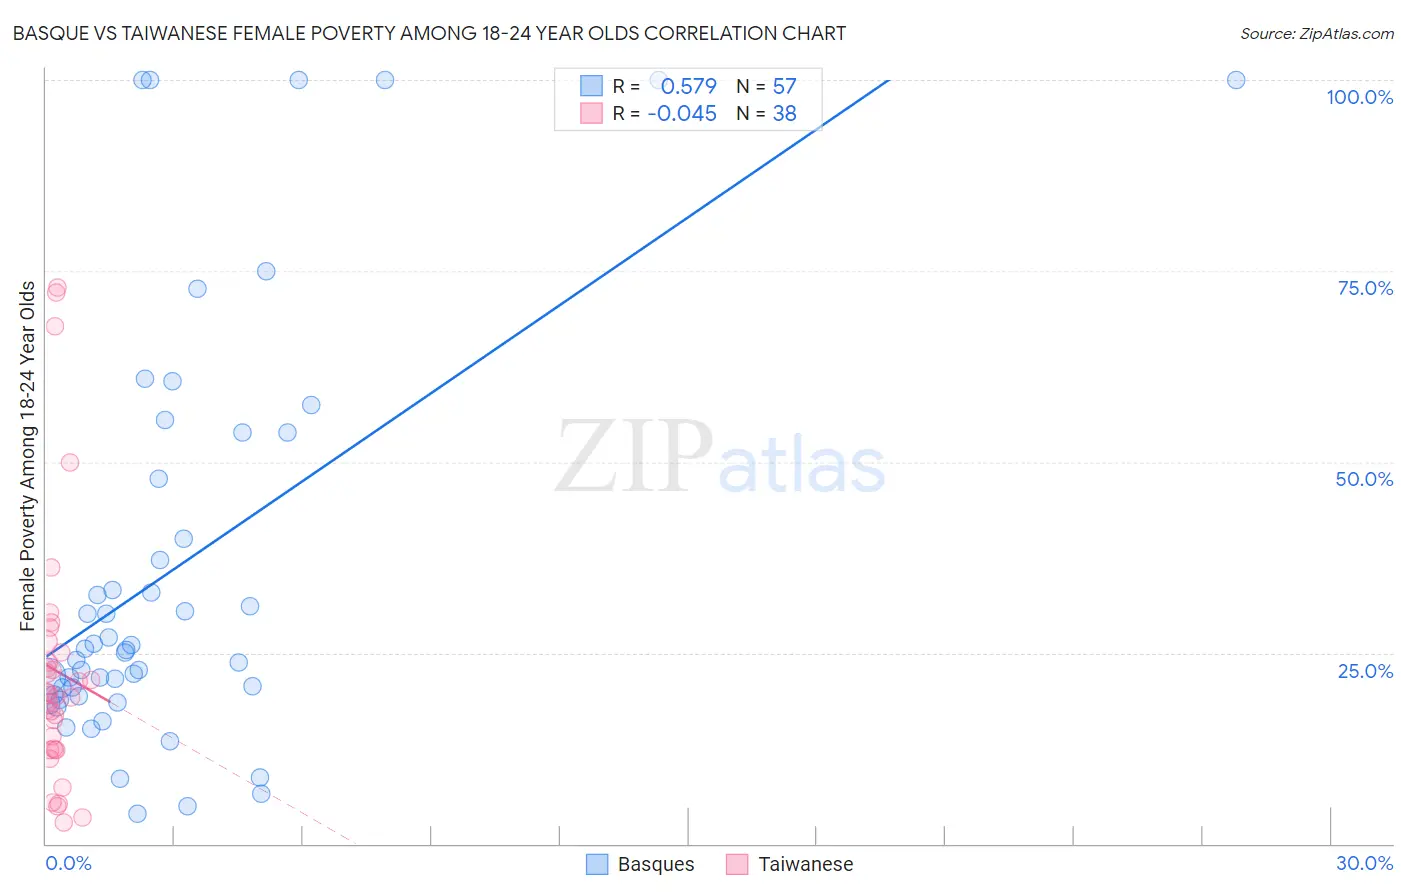
Basque vs Taiwanese Female Poverty Among 18-24 Year Olds Correlation Chart
The statistical analysis conducted on geographies consisting of 164,234,087 people shows a substantial positive correlation between the proportion of Basques and poverty level among females between the ages 18 and 24 in the United States with a correlation coefficient (R) of 0.579 and weighted average of 21.7%. Similarly, the statistical analysis conducted on geographies consisting of 31,675,814 people shows no correlation between the proportion of Taiwanese and poverty level among females between the ages 18 and 24 in the United States with a correlation coefficient (R) of -0.045 and weighted average of 21.2%, a difference of 2.0%.
Female Poverty Among 18-24 Year Olds Correlation Summary
| Measurement | Basque | Taiwanese |
| Minimum | 4.0% | 2.8% |
| Maximum | 100.0% | 72.8% |
| Range | 96.0% | 69.9% |
| Mean | 36.1% | 22.6% |
| Median | 25.4% | 19.4% |
| Interquartile 25% (IQ1) | 19.4% | 12.3% |
| Interquartile 75% (IQ3) | 50.8% | 25.0% |
| Interquartile Range (IQR) | 31.4% | 12.7% |
| Standard Deviation (Sample) | 27.2% | 17.1% |
| Standard Deviation (Population) | 26.9% | 16.9% |
Demographics Similar to Basques and Taiwanese by Female Poverty Among 18-24 Year Olds
In terms of female poverty among 18-24 year olds, the demographic groups most similar to Basques are New Zealander (21.7%, a difference of 0.14%), Scotch-Irish (21.6%, a difference of 0.27%), Mongolian (21.6%, a difference of 0.29%), Celtic (21.6%, a difference of 0.32%), and Immigrants from Burma/Myanmar (21.6%, a difference of 0.37%). Similarly, the demographic groups most similar to Taiwanese are Tsimshian (21.2%, a difference of 0.10%), Immigrants from Grenada (21.2%, a difference of 0.26%), British West Indian (21.2%, a difference of 0.29%), Vietnamese (21.4%, a difference of 0.54%), and Immigrants from France (21.4%, a difference of 0.57%).
| Demographics | Rating | Rank | Female Poverty Among 18-24 Year Olds |
| British West Indians | 1.2 /100 | #254 | Tragic 21.2% |
| Immigrants | Grenada | 1.2 /100 | #255 | Tragic 21.2% |
| Tsimshian | 1.0 /100 | #256 | Tragic 21.2% |
| Taiwanese | 1.0 /100 | #257 | Tragic 21.2% |
| Vietnamese | 0.6 /100 | #258 | Tragic 21.4% |
| Immigrants | France | 0.6 /100 | #259 | Tragic 21.4% |
| Immigrants | Norway | 0.6 /100 | #260 | Tragic 21.4% |
| Immigrants | Bahamas | 0.5 /100 | #261 | Tragic 21.4% |
| Immigrants | Eastern Africa | 0.4 /100 | #262 | Tragic 21.4% |
| Icelanders | 0.3 /100 | #263 | Tragic 21.5% |
| Hondurans | 0.3 /100 | #264 | Tragic 21.5% |
| Immigrants | Nonimmigrants | 0.3 /100 | #265 | Tragic 21.5% |
| Alaska Natives | 0.3 /100 | #266 | Tragic 21.5% |
| Americans | 0.3 /100 | #267 | Tragic 21.6% |
| Immigrants | Burma/Myanmar | 0.2 /100 | #268 | Tragic 21.6% |
| Celtics | 0.2 /100 | #269 | Tragic 21.6% |
| Mongolians | 0.2 /100 | #270 | Tragic 21.6% |
| Scotch-Irish | 0.2 /100 | #271 | Tragic 21.6% |
| Basques | 0.2 /100 | #272 | Tragic 21.7% |
| New Zealanders | 0.2 /100 | #273 | Tragic 21.7% |
| Immigrants | Honduras | 0.1 /100 | #274 | Tragic 21.8% |