Palestinian vs Immigrants from Honduras Seniors Poverty Over the Age of 65
COMPARE
Palestinian
Immigrants from Honduras
Seniors Poverty Over the Age of 65
Seniors Poverty Over the Age of 65 Comparison
Palestinians
Immigrants from Honduras
10.0%
SENIORS POVERTY OVER THE AGE OF 65
97.9/ 100
METRIC RATING
72nd/ 347
METRIC RANK
14.5%
SENIORS POVERTY OVER THE AGE OF 65
0.0/ 100
METRIC RATING
318th/ 347
METRIC RANK
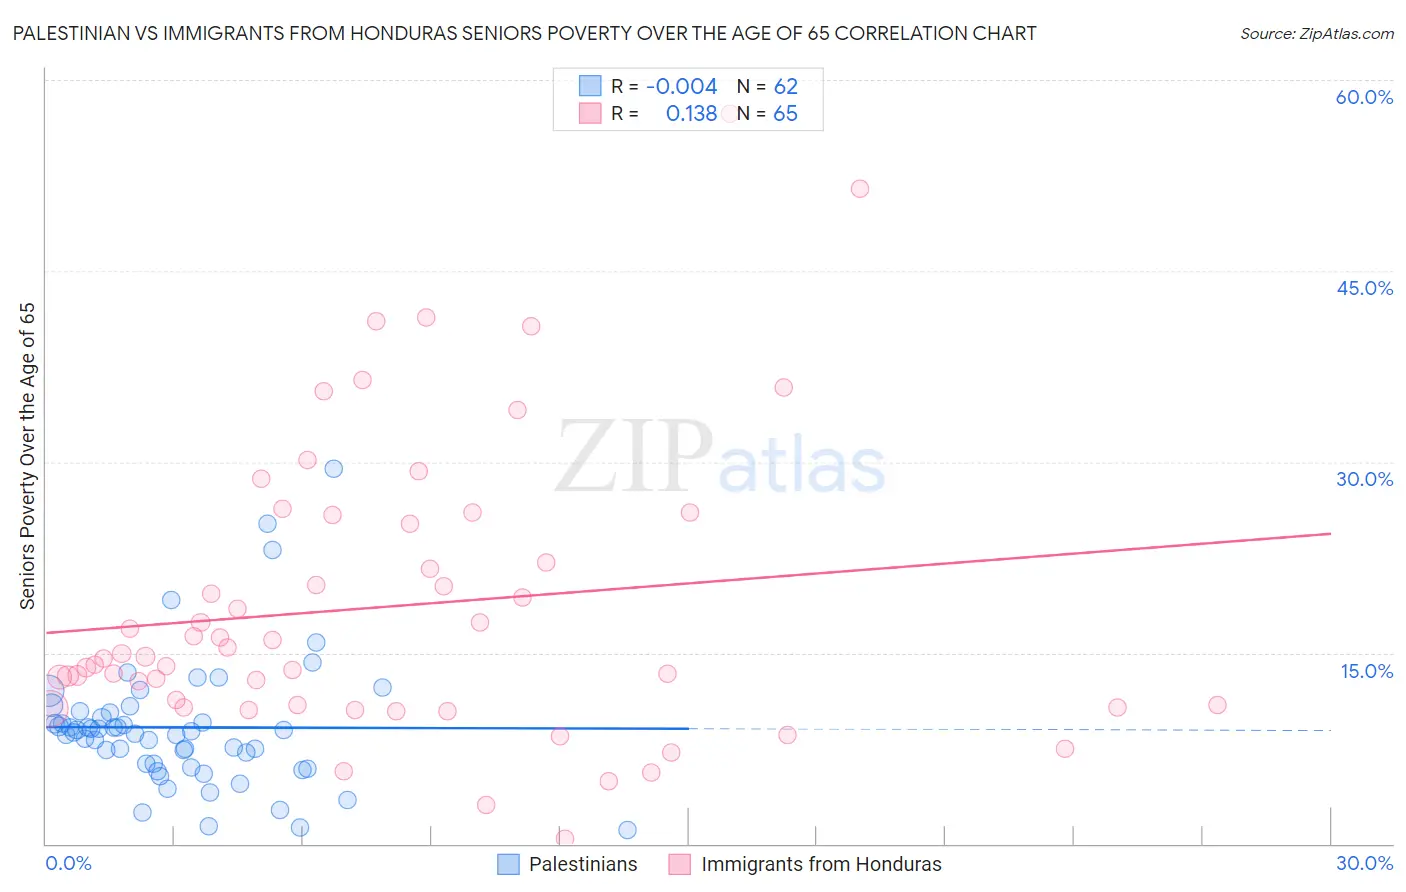
Palestinian vs Immigrants from Honduras Seniors Poverty Over the Age of 65 Correlation Chart
The statistical analysis conducted on geographies consisting of 216,096,591 people shows no correlation between the proportion of Palestinians and poverty level among seniors over the age of 65 in the United States with a correlation coefficient (R) of -0.004 and weighted average of 10.0%. Similarly, the statistical analysis conducted on geographies consisting of 322,012,032 people shows a poor positive correlation between the proportion of Immigrants from Honduras and poverty level among seniors over the age of 65 in the United States with a correlation coefficient (R) of 0.138 and weighted average of 14.5%, a difference of 44.9%.
Seniors Poverty Over the Age of 65 Correlation Summary
| Measurement | Palestinian | Immigrants from Honduras |
| Minimum | 1.1% | 0.43% |
| Maximum | 29.5% | 57.4% |
| Range | 28.4% | 57.0% |
| Mean | 9.1% | 18.6% |
| Median | 8.8% | 14.7% |
| Interquartile 25% (IQ1) | 6.3% | 10.8% |
| Interquartile 75% (IQ3) | 10.4% | 25.5% |
| Interquartile Range (IQR) | 4.1% | 14.7% |
| Standard Deviation (Sample) | 5.1% | 11.5% |
| Standard Deviation (Population) | 5.1% | 11.4% |
Similar Demographics by Seniors Poverty Over the Age of 65
Demographics Similar to Palestinians by Seniors Poverty Over the Age of 65
In terms of seniors poverty over the age of 65, the demographic groups most similar to Palestinians are Yugoslavian (10.0%, a difference of 0.020%), Russian (10.0%, a difference of 0.030%), Turkish (10.0%, a difference of 0.050%), Samoan (10.0%, a difference of 0.060%), and Immigrants from Czechoslovakia (10.0%, a difference of 0.14%).
| Demographics | Rating | Rank | Seniors Poverty Over the Age of 65 |
| Pennsylvania Germans | 98.7 /100 | #65 | Exceptional 9.9% |
| Immigrants | Netherlands | 98.7 /100 | #66 | Exceptional 9.9% |
| Immigrants | Austria | 98.6 /100 | #67 | Exceptional 9.9% |
| Canadians | 98.5 /100 | #68 | Exceptional 9.9% |
| Australians | 98.4 /100 | #69 | Exceptional 9.9% |
| Samoans | 98.0 /100 | #70 | Exceptional 10.0% |
| Yugoslavians | 97.9 /100 | #71 | Exceptional 10.0% |
| Palestinians | 97.9 /100 | #72 | Exceptional 10.0% |
| Russians | 97.9 /100 | #73 | Exceptional 10.0% |
| Turks | 97.9 /100 | #74 | Exceptional 10.0% |
| Immigrants | Czechoslovakia | 97.8 /100 | #75 | Exceptional 10.0% |
| New Zealanders | 97.7 /100 | #76 | Exceptional 10.0% |
| Immigrants | South Africa | 97.7 /100 | #77 | Exceptional 10.0% |
| Whites/Caucasians | 97.5 /100 | #78 | Exceptional 10.0% |
| Immigrants | Ireland | 97.5 /100 | #79 | Exceptional 10.0% |
Demographics Similar to Immigrants from Honduras by Seniors Poverty Over the Age of 65
In terms of seniors poverty over the age of 65, the demographic groups most similar to Immigrants from Honduras are Haitian (14.5%, a difference of 0.21%), Immigrants from Guyana (14.5%, a difference of 0.24%), Immigrants from Ecuador (14.4%, a difference of 0.45%), Guyanese (14.4%, a difference of 0.49%), and Barbadian (14.4%, a difference of 0.88%).
| Demographics | Rating | Rank | Seniors Poverty Over the Age of 65 |
| Natives/Alaskans | 0.0 /100 | #311 | Tragic 14.2% |
| Hispanics or Latinos | 0.0 /100 | #312 | Tragic 14.3% |
| Barbadians | 0.0 /100 | #313 | Tragic 14.4% |
| Guyanese | 0.0 /100 | #314 | Tragic 14.4% |
| Immigrants | Ecuador | 0.0 /100 | #315 | Tragic 14.4% |
| Immigrants | Guyana | 0.0 /100 | #316 | Tragic 14.5% |
| Haitians | 0.0 /100 | #317 | Tragic 14.5% |
| Immigrants | Honduras | 0.0 /100 | #318 | Tragic 14.5% |
| Cape Verdeans | 0.0 /100 | #319 | Tragic 14.7% |
| Immigrants | Haiti | 0.0 /100 | #320 | Tragic 14.7% |
| Houma | 0.0 /100 | #321 | Tragic 14.7% |
| Immigrants | Barbados | 0.0 /100 | #322 | Tragic 14.8% |
| Yakama | 0.0 /100 | #323 | Tragic 14.8% |
| Nicaraguans | 0.0 /100 | #324 | Tragic 15.0% |
| Central American Indians | 0.0 /100 | #325 | Tragic 15.1% |