Paiute vs French Seniors Poverty Over the Age of 65
COMPARE
Paiute
French
Seniors Poverty Over the Age of 65
Seniors Poverty Over the Age of 65 Comparison
Paiute
French
12.9%
SENIORS POVERTY OVER THE AGE OF 65
0.0/ 100
METRIC RATING
277th/ 347
METRIC RANK
9.7%
SENIORS POVERTY OVER THE AGE OF 65
99.5/ 100
METRIC RATING
48th/ 347
METRIC RANK
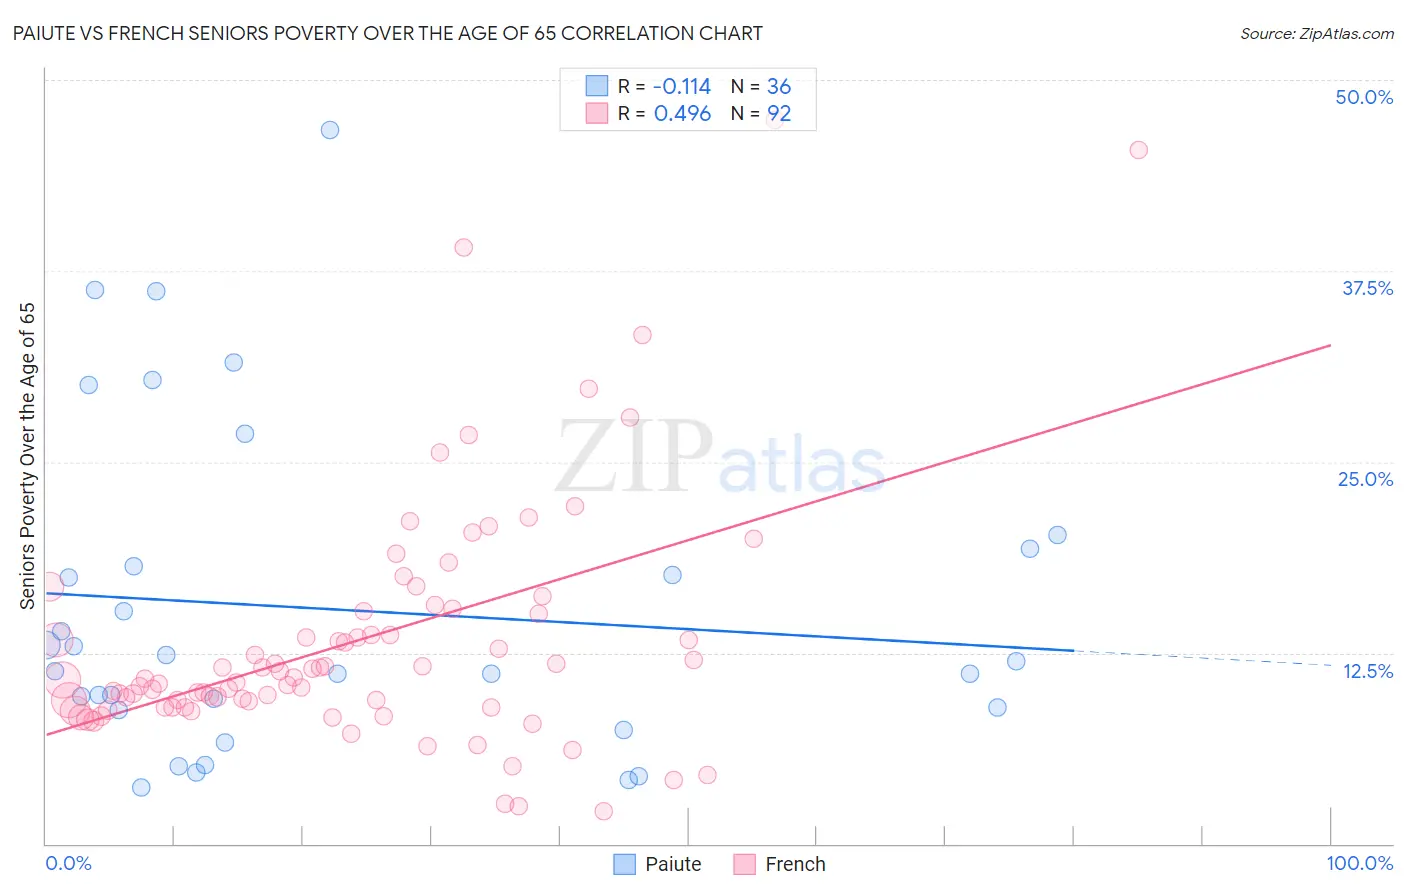
Paiute vs French Seniors Poverty Over the Age of 65 Correlation Chart
The statistical analysis conducted on geographies consisting of 58,360,776 people shows a poor negative correlation between the proportion of Paiute and poverty level among seniors over the age of 65 in the United States with a correlation coefficient (R) of -0.114 and weighted average of 12.9%. Similarly, the statistical analysis conducted on geographies consisting of 566,848,450 people shows a moderate positive correlation between the proportion of French and poverty level among seniors over the age of 65 in the United States with a correlation coefficient (R) of 0.496 and weighted average of 9.7%, a difference of 33.8%.
Seniors Poverty Over the Age of 65 Correlation Summary
| Measurement | Paiute | French |
| Minimum | 3.7% | 2.2% |
| Maximum | 46.8% | 47.4% |
| Range | 43.1% | 45.2% |
| Mean | 15.3% | 13.3% |
| Median | 11.6% | 10.8% |
| Interquartile 25% (IQ1) | 8.8% | 8.9% |
| Interquartile 75% (IQ3) | 18.8% | 15.1% |
| Interquartile Range (IQR) | 9.9% | 6.2% |
| Standard Deviation (Sample) | 10.6% | 8.1% |
| Standard Deviation (Population) | 10.4% | 8.0% |
Similar Demographics by Seniors Poverty Over the Age of 65
Demographics Similar to Paiute by Seniors Poverty Over the Age of 65
In terms of seniors poverty over the age of 65, the demographic groups most similar to Paiute are Immigrants from the Azores (12.9%, a difference of 0.090%), Immigrants from Colombia (12.9%, a difference of 0.32%), Immigrants from Bahamas (13.0%, a difference of 0.83%), Mexican (13.1%, a difference of 0.98%), and Salvadoran (12.8%, a difference of 0.99%).
| Demographics | Rating | Rank | Seniors Poverty Over the Age of 65 |
| Immigrants | South America | 0.1 /100 | #270 | Tragic 12.7% |
| Immigrants | Ghana | 0.1 /100 | #271 | Tragic 12.8% |
| Immigrants | Uruguay | 0.1 /100 | #272 | Tragic 12.8% |
| Kiowa | 0.0 /100 | #273 | Tragic 12.8% |
| Salvadorans | 0.0 /100 | #274 | Tragic 12.8% |
| Immigrants | Colombia | 0.0 /100 | #275 | Tragic 12.9% |
| Immigrants | Azores | 0.0 /100 | #276 | Tragic 12.9% |
| Paiute | 0.0 /100 | #277 | Tragic 12.9% |
| Immigrants | Bahamas | 0.0 /100 | #278 | Tragic 13.0% |
| Mexicans | 0.0 /100 | #279 | Tragic 13.1% |
| Yuman | 0.0 /100 | #280 | Tragic 13.1% |
| Immigrants | El Salvador | 0.0 /100 | #281 | Tragic 13.1% |
| Senegalese | 0.0 /100 | #282 | Tragic 13.3% |
| Central Americans | 0.0 /100 | #283 | Tragic 13.4% |
| Colville | 0.0 /100 | #284 | Tragic 13.5% |
Demographics Similar to French by Seniors Poverty Over the Age of 65
In terms of seniors poverty over the age of 65, the demographic groups most similar to French are Immigrants from Lithuania (9.7%, a difference of 0.060%), Immigrants from South Central Asia (9.7%, a difference of 0.11%), Immigrants from Taiwan (9.7%, a difference of 0.12%), Estonian (9.6%, a difference of 0.25%), and Hungarian (9.7%, a difference of 0.28%).
| Demographics | Rating | Rank | Seniors Poverty Over the Age of 65 |
| Immigrants | North Macedonia | 99.6 /100 | #41 | Exceptional 9.6% |
| Zimbabweans | 99.6 /100 | #42 | Exceptional 9.6% |
| Eastern Europeans | 99.6 /100 | #43 | Exceptional 9.6% |
| Austrians | 99.5 /100 | #44 | Exceptional 9.6% |
| Estonians | 99.5 /100 | #45 | Exceptional 9.6% |
| Immigrants | Taiwan | 99.5 /100 | #46 | Exceptional 9.7% |
| Immigrants | South Central Asia | 99.5 /100 | #47 | Exceptional 9.7% |
| French | 99.5 /100 | #48 | Exceptional 9.7% |
| Immigrants | Lithuania | 99.4 /100 | #49 | Exceptional 9.7% |
| Hungarians | 99.4 /100 | #50 | Exceptional 9.7% |
| Carpatho Rusyns | 99.3 /100 | #51 | Exceptional 9.7% |
| Filipinos | 99.3 /100 | #52 | Exceptional 9.7% |
| Slavs | 99.2 /100 | #53 | Exceptional 9.8% |
| Immigrants | Northern Europe | 99.2 /100 | #54 | Exceptional 9.8% |
| Afghans | 99.2 /100 | #55 | Exceptional 9.8% |