Nigerian vs Welsh Child Poverty Among Boys Under 16
COMPARE
Nigerian
Welsh
Child Poverty Among Boys Under 16
Child Poverty Among Boys Under 16 Comparison
Nigerians
Welsh
18.5%
CHILD POVERTY AMONG BOYS UNDER 16
1.1/ 100
METRIC RATING
234th/ 347
METRIC RANK
15.5%
CHILD POVERTY AMONG BOYS UNDER 16
88.3/ 100
METRIC RATING
133rd/ 347
METRIC RANK
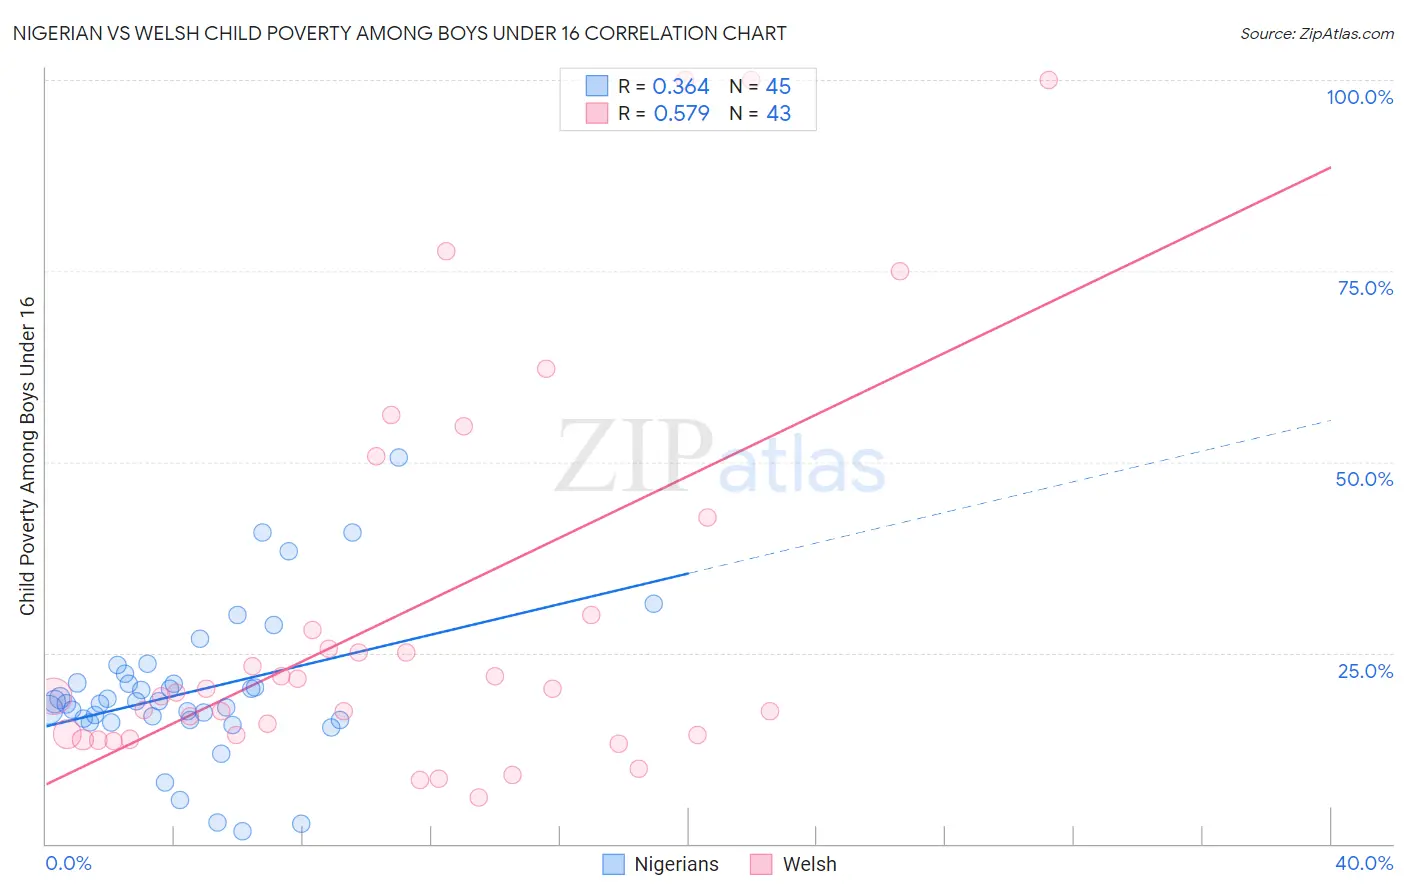
Nigerian vs Welsh Child Poverty Among Boys Under 16 Correlation Chart
The statistical analysis conducted on geographies consisting of 329,481,390 people shows a mild positive correlation between the proportion of Nigerians and poverty level among boys under the age of 16 in the United States with a correlation coefficient (R) of 0.364 and weighted average of 18.5%. Similarly, the statistical analysis conducted on geographies consisting of 512,560,800 people shows a substantial positive correlation between the proportion of Welsh and poverty level among boys under the age of 16 in the United States with a correlation coefficient (R) of 0.579 and weighted average of 15.5%, a difference of 19.2%.
Child Poverty Among Boys Under 16 Correlation Summary
| Measurement | Nigerian | Welsh |
| Minimum | 1.7% | 6.1% |
| Maximum | 50.6% | 100.0% |
| Range | 48.9% | 93.9% |
| Mean | 19.9% | 30.1% |
| Median | 18.6% | 19.8% |
| Interquartile 25% (IQ1) | 16.2% | 14.3% |
| Interquartile 75% (IQ3) | 21.6% | 30.0% |
| Interquartile Range (IQR) | 5.4% | 15.7% |
| Standard Deviation (Sample) | 9.6% | 25.9% |
| Standard Deviation (Population) | 9.5% | 25.6% |
Similar Demographics by Child Poverty Among Boys Under 16
Demographics Similar to Nigerians by Child Poverty Among Boys Under 16
In terms of child poverty among boys under 16, the demographic groups most similar to Nigerians are Immigrants from Nigeria (18.4%, a difference of 0.25%), Marshallese (18.4%, a difference of 0.44%), American (18.6%, a difference of 0.50%), Sudanese (18.6%, a difference of 0.59%), and Nicaraguan (18.4%, a difference of 0.64%).
| Demographics | Rating | Rank | Child Poverty Among Boys Under 16 |
| Bermudans | 2.5 /100 | #227 | Tragic 18.1% |
| Immigrants | Nonimmigrants | 2.2 /100 | #228 | Tragic 18.2% |
| Immigrants | Micronesia | 1.8 /100 | #229 | Tragic 18.3% |
| Fijians | 1.8 /100 | #230 | Tragic 18.3% |
| Nicaraguans | 1.4 /100 | #231 | Tragic 18.4% |
| Marshallese | 1.3 /100 | #232 | Tragic 18.4% |
| Immigrants | Nigeria | 1.2 /100 | #233 | Tragic 18.4% |
| Nigerians | 1.1 /100 | #234 | Tragic 18.5% |
| Americans | 0.9 /100 | #235 | Tragic 18.6% |
| Sudanese | 0.9 /100 | #236 | Tragic 18.6% |
| Immigrants | Eritrea | 0.8 /100 | #237 | Tragic 18.6% |
| Immigrants | Laos | 0.8 /100 | #238 | Tragic 18.7% |
| Cape Verdeans | 0.7 /100 | #239 | Tragic 18.7% |
| Immigrants | Cuba | 0.6 /100 | #240 | Tragic 18.8% |
| Immigrants | Sudan | 0.6 /100 | #241 | Tragic 18.8% |
Demographics Similar to Welsh by Child Poverty Among Boys Under 16
In terms of child poverty among boys under 16, the demographic groups most similar to Welsh are Peruvian (15.5%, a difference of 0.040%), Immigrants from Kazakhstan (15.5%, a difference of 0.11%), Portuguese (15.5%, a difference of 0.21%), Icelander (15.5%, a difference of 0.23%), and Immigrants from Spain (15.6%, a difference of 0.33%).
| Demographics | Rating | Rank | Child Poverty Among Boys Under 16 |
| Palestinians | 91.3 /100 | #126 | Exceptional 15.4% |
| Carpatho Rusyns | 91.1 /100 | #127 | Exceptional 15.4% |
| Canadians | 90.6 /100 | #128 | Exceptional 15.4% |
| Immigrants | Brazil | 90.3 /100 | #129 | Exceptional 15.4% |
| Mongolians | 90.2 /100 | #130 | Exceptional 15.4% |
| Immigrants | Western Europe | 90.0 /100 | #131 | Exceptional 15.4% |
| Immigrants | Kazakhstan | 88.7 /100 | #132 | Excellent 15.5% |
| Welsh | 88.3 /100 | #133 | Excellent 15.5% |
| Peruvians | 88.1 /100 | #134 | Excellent 15.5% |
| Portuguese | 87.5 /100 | #135 | Excellent 15.5% |
| Icelanders | 87.5 /100 | #136 | Excellent 15.5% |
| Immigrants | Spain | 87.1 /100 | #137 | Excellent 15.6% |
| Immigrants | Southern Europe | 86.5 /100 | #138 | Excellent 15.6% |
| Albanians | 86.5 /100 | #139 | Excellent 15.6% |
| Immigrants | Kuwait | 85.6 /100 | #140 | Excellent 15.6% |