Nigerian vs Mexican Child Poverty Among Boys Under 16
COMPARE
Nigerian
Mexican
Child Poverty Among Boys Under 16
Child Poverty Among Boys Under 16 Comparison
Nigerians
Mexicans
18.5%
CHILD POVERTY AMONG BOYS UNDER 16
1.1/ 100
METRIC RATING
234th/ 347
METRIC RANK
20.7%
CHILD POVERTY AMONG BOYS UNDER 16
0.0/ 100
METRIC RATING
295th/ 347
METRIC RANK
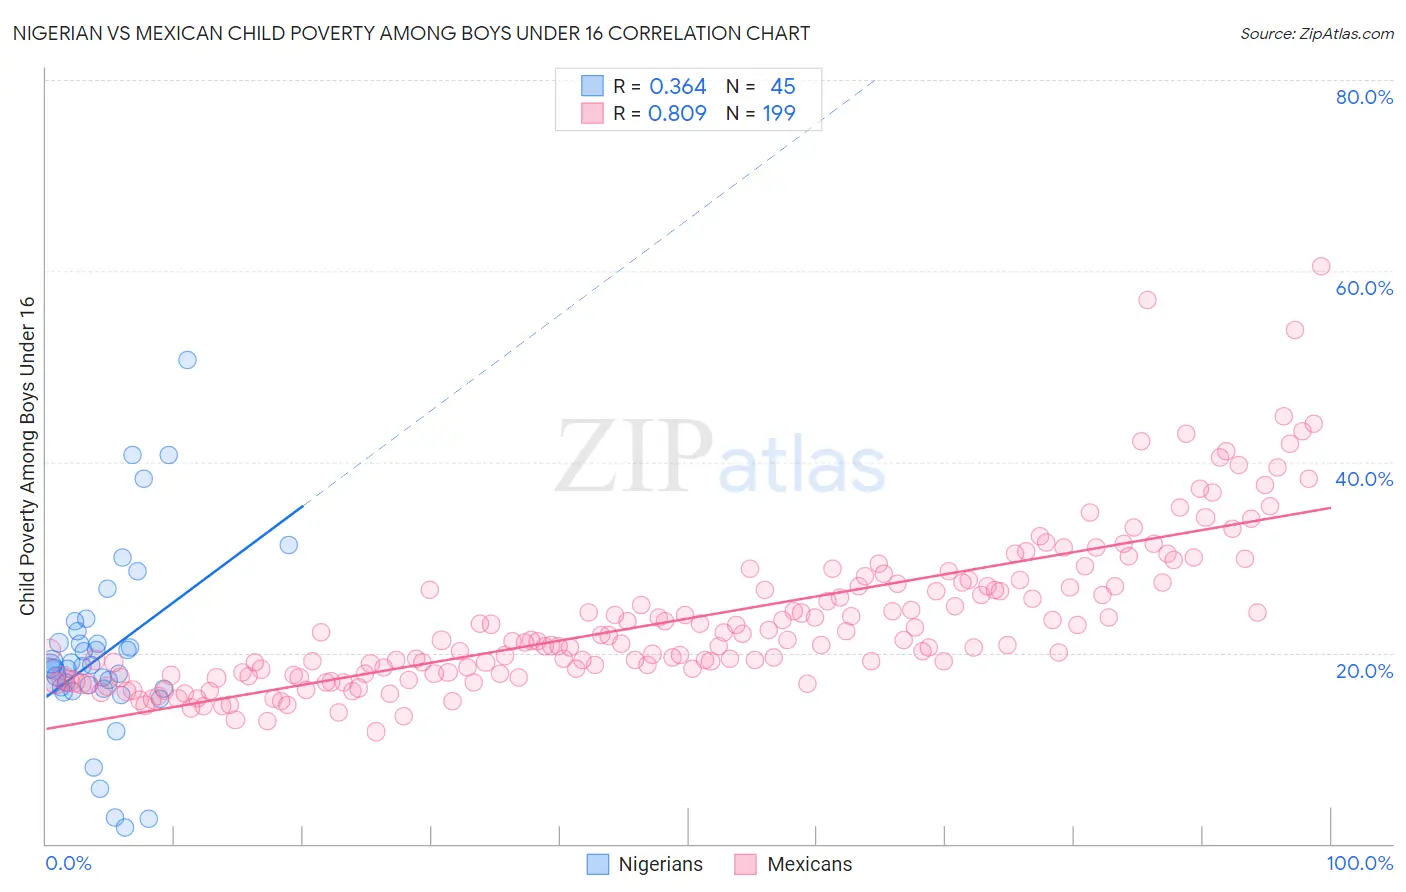
Nigerian vs Mexican Child Poverty Among Boys Under 16 Correlation Chart
The statistical analysis conducted on geographies consisting of 329,481,390 people shows a mild positive correlation between the proportion of Nigerians and poverty level among boys under the age of 16 in the United States with a correlation coefficient (R) of 0.364 and weighted average of 18.5%. Similarly, the statistical analysis conducted on geographies consisting of 547,581,347 people shows a very strong positive correlation between the proportion of Mexicans and poverty level among boys under the age of 16 in the United States with a correlation coefficient (R) of 0.809 and weighted average of 20.7%, a difference of 12.2%.
Child Poverty Among Boys Under 16 Correlation Summary
| Measurement | Nigerian | Mexican |
| Minimum | 1.7% | 11.7% |
| Maximum | 50.6% | 60.4% |
| Range | 48.9% | 48.7% |
| Mean | 19.9% | 23.5% |
| Median | 18.6% | 21.2% |
| Interquartile 25% (IQ1) | 16.2% | 17.8% |
| Interquartile 75% (IQ3) | 21.6% | 27.0% |
| Interquartile Range (IQR) | 5.4% | 9.2% |
| Standard Deviation (Sample) | 9.6% | 8.2% |
| Standard Deviation (Population) | 9.5% | 8.2% |
Similar Demographics by Child Poverty Among Boys Under 16
Demographics Similar to Nigerians by Child Poverty Among Boys Under 16
In terms of child poverty among boys under 16, the demographic groups most similar to Nigerians are Immigrants from Nigeria (18.4%, a difference of 0.25%), Marshallese (18.4%, a difference of 0.44%), American (18.6%, a difference of 0.50%), Sudanese (18.6%, a difference of 0.59%), and Nicaraguan (18.4%, a difference of 0.64%).
| Demographics | Rating | Rank | Child Poverty Among Boys Under 16 |
| Bermudans | 2.5 /100 | #227 | Tragic 18.1% |
| Immigrants | Nonimmigrants | 2.2 /100 | #228 | Tragic 18.2% |
| Immigrants | Micronesia | 1.8 /100 | #229 | Tragic 18.3% |
| Fijians | 1.8 /100 | #230 | Tragic 18.3% |
| Nicaraguans | 1.4 /100 | #231 | Tragic 18.4% |
| Marshallese | 1.3 /100 | #232 | Tragic 18.4% |
| Immigrants | Nigeria | 1.2 /100 | #233 | Tragic 18.4% |
| Nigerians | 1.1 /100 | #234 | Tragic 18.5% |
| Americans | 0.9 /100 | #235 | Tragic 18.6% |
| Sudanese | 0.9 /100 | #236 | Tragic 18.6% |
| Immigrants | Eritrea | 0.8 /100 | #237 | Tragic 18.6% |
| Immigrants | Laos | 0.8 /100 | #238 | Tragic 18.7% |
| Cape Verdeans | 0.7 /100 | #239 | Tragic 18.7% |
| Immigrants | Cuba | 0.6 /100 | #240 | Tragic 18.8% |
| Immigrants | Sudan | 0.6 /100 | #241 | Tragic 18.8% |
Demographics Similar to Mexicans by Child Poverty Among Boys Under 16
In terms of child poverty among boys under 16, the demographic groups most similar to Mexicans are Immigrants from Bahamas (20.7%, a difference of 0.13%), Indonesian (20.8%, a difference of 0.20%), Immigrants from Senegal (20.7%, a difference of 0.24%), Yaqui (20.7%, a difference of 0.25%), and Immigrants from Latin America (20.6%, a difference of 0.52%).
| Demographics | Rating | Rank | Child Poverty Among Boys Under 16 |
| Immigrants | St. Vincent and the Grenadines | 0.0 /100 | #288 | Tragic 20.3% |
| Blackfeet | 0.0 /100 | #289 | Tragic 20.4% |
| Senegalese | 0.0 /100 | #290 | Tragic 20.6% |
| Immigrants | Latin America | 0.0 /100 | #291 | Tragic 20.6% |
| Yaqui | 0.0 /100 | #292 | Tragic 20.7% |
| Immigrants | Senegal | 0.0 /100 | #293 | Tragic 20.7% |
| Immigrants | Bahamas | 0.0 /100 | #294 | Tragic 20.7% |
| Mexicans | 0.0 /100 | #295 | Tragic 20.7% |
| Indonesians | 0.0 /100 | #296 | Tragic 20.8% |
| Hispanics or Latinos | 0.0 /100 | #297 | Tragic 20.9% |
| Chippewa | 0.0 /100 | #298 | Tragic 21.0% |
| Immigrants | Caribbean | 0.0 /100 | #299 | Tragic 21.0% |
| Haitians | 0.0 /100 | #300 | Tragic 21.0% |
| Guatemalans | 0.0 /100 | #301 | Tragic 21.1% |
| Somalis | 0.0 /100 | #302 | Tragic 21.1% |