Mongolian vs Slovak Seniors Poverty Over the Age of 75
COMPARE
Mongolian
Slovak
Seniors Poverty Over the Age of 75
Seniors Poverty Over the Age of 75 Comparison
Mongolians
Slovaks
12.2%
SENIORS POVERTY OVER THE AGE OF 75
45.5/ 100
METRIC RATING
179th/ 347
METRIC RANK
10.5%
SENIORS POVERTY OVER THE AGE OF 75
99.9/ 100
METRIC RATING
17th/ 347
METRIC RANK
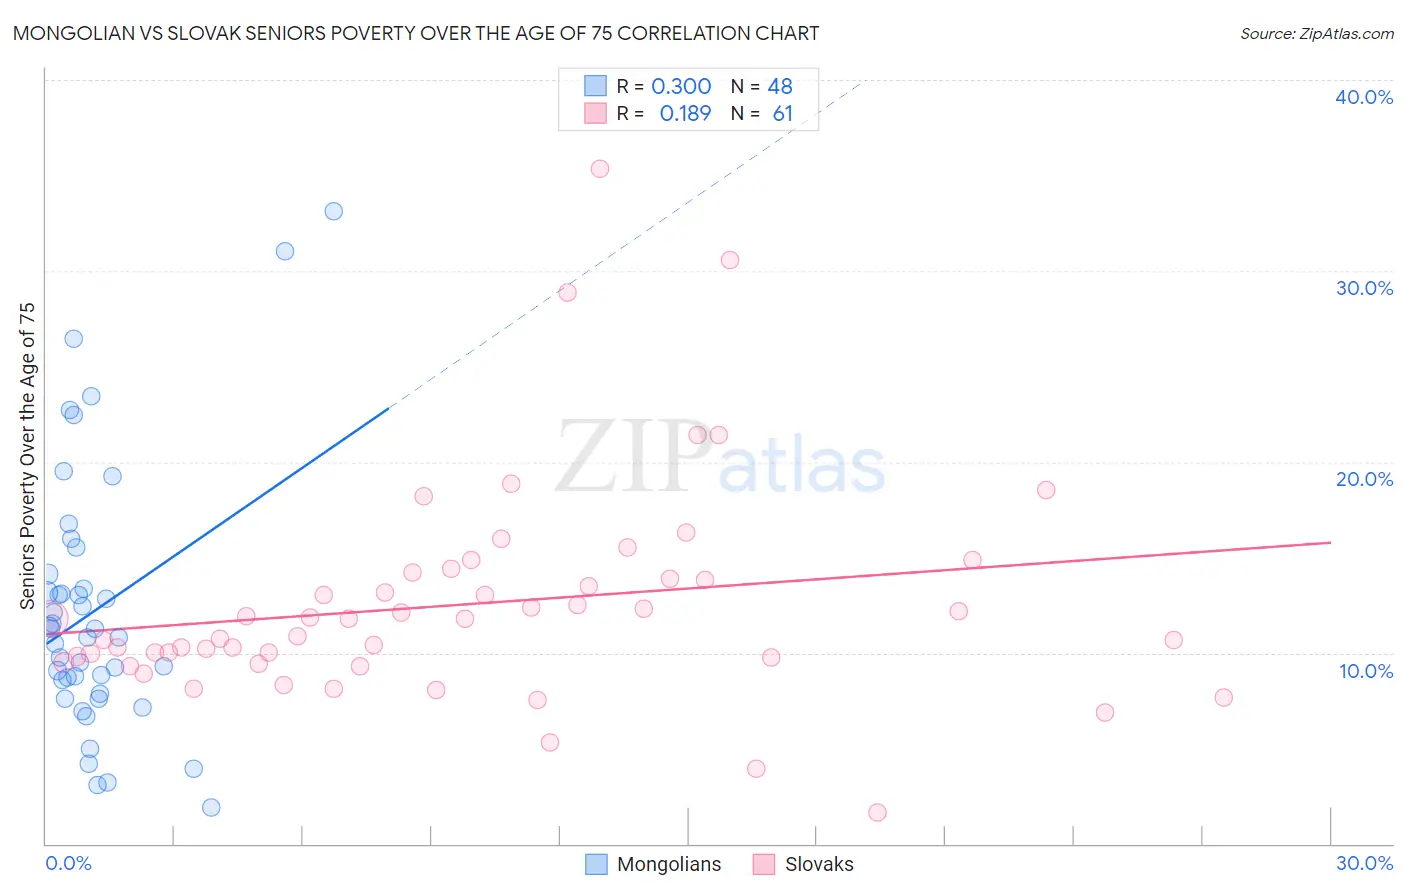
Mongolian vs Slovak Seniors Poverty Over the Age of 75 Correlation Chart
The statistical analysis conducted on geographies consisting of 139,832,325 people shows a weak positive correlation between the proportion of Mongolians and poverty level among seniors over the age of 75 in the United States with a correlation coefficient (R) of 0.300 and weighted average of 12.2%. Similarly, the statistical analysis conducted on geographies consisting of 392,230,662 people shows a poor positive correlation between the proportion of Slovaks and poverty level among seniors over the age of 75 in the United States with a correlation coefficient (R) of 0.189 and weighted average of 10.5%, a difference of 16.0%.
Seniors Poverty Over the Age of 75 Correlation Summary
| Measurement | Mongolian | Slovak |
| Minimum | 1.9% | 1.7% |
| Maximum | 33.1% | 35.3% |
| Range | 31.3% | 33.7% |
| Mean | 12.2% | 12.6% |
| Median | 11.0% | 11.8% |
| Interquartile 25% (IQ1) | 8.2% | 9.6% |
| Interquartile 75% (IQ3) | 13.7% | 14.1% |
| Interquartile Range (IQR) | 5.5% | 4.4% |
| Standard Deviation (Sample) | 6.8% | 5.7% |
| Standard Deviation (Population) | 6.8% | 5.7% |
Similar Demographics by Seniors Poverty Over the Age of 75
Demographics Similar to Mongolians by Seniors Poverty Over the Age of 75
In terms of seniors poverty over the age of 75, the demographic groups most similar to Mongolians are Immigrants from South Eastern Asia (12.2%, a difference of 0.10%), Nonimmigrants (12.2%, a difference of 0.11%), Immigrants from Australia (12.2%, a difference of 0.11%), Immigrants from Asia (12.2%, a difference of 0.19%), and Immigrants from Iran (12.2%, a difference of 0.21%).
| Demographics | Rating | Rank | Seniors Poverty Over the Age of 75 |
| Immigrants | Fiji | 51.5 /100 | #172 | Average 12.2% |
| Arabs | 50.5 /100 | #173 | Average 12.2% |
| Immigrants | Europe | 50.0 /100 | #174 | Average 12.2% |
| Immigrants | Saudi Arabia | 49.5 /100 | #175 | Average 12.2% |
| Immigrants | Iran | 48.1 /100 | #176 | Average 12.2% |
| Immigrants | Asia | 47.8 /100 | #177 | Average 12.2% |
| Immigrants | Nonimmigrants | 46.8 /100 | #178 | Average 12.2% |
| Mongolians | 45.5 /100 | #179 | Average 12.2% |
| Immigrants | South Eastern Asia | 44.3 /100 | #180 | Average 12.2% |
| Immigrants | Australia | 44.2 /100 | #181 | Average 12.2% |
| German Russians | 41.4 /100 | #182 | Average 12.3% |
| Laotians | 38.2 /100 | #183 | Fair 12.3% |
| Kiowa | 36.0 /100 | #184 | Fair 12.3% |
| Immigrants | Malaysia | 35.8 /100 | #185 | Fair 12.3% |
| Sri Lankans | 32.3 /100 | #186 | Fair 12.4% |
Demographics Similar to Slovaks by Seniors Poverty Over the Age of 75
In terms of seniors poverty over the age of 75, the demographic groups most similar to Slovaks are Welsh (10.5%, a difference of 0.010%), Immigrants from Scotland (10.5%, a difference of 0.040%), Czech (10.5%, a difference of 0.060%), Slovene (10.6%, a difference of 0.10%), and Dutch (10.5%, a difference of 0.21%).
| Demographics | Rating | Rank | Seniors Poverty Over the Age of 75 |
| Scandinavians | 99.9 /100 | #10 | Exceptional 10.4% |
| Immigrants | India | 99.9 /100 | #11 | Exceptional 10.4% |
| Tongans | 99.9 /100 | #12 | Exceptional 10.5% |
| Croatians | 99.9 /100 | #13 | Exceptional 10.5% |
| Scottish | 99.9 /100 | #14 | Exceptional 10.5% |
| Europeans | 99.9 /100 | #15 | Exceptional 10.5% |
| Dutch | 99.9 /100 | #16 | Exceptional 10.5% |
| Slovaks | 99.9 /100 | #17 | Exceptional 10.5% |
| Welsh | 99.9 /100 | #18 | Exceptional 10.5% |
| Immigrants | Scotland | 99.9 /100 | #19 | Exceptional 10.5% |
| Czechs | 99.9 /100 | #20 | Exceptional 10.5% |
| Slovenes | 99.9 /100 | #21 | Exceptional 10.6% |
| Bhutanese | 99.8 /100 | #22 | Exceptional 10.6% |
| Lithuanians | 99.8 /100 | #23 | Exceptional 10.6% |
| Poles | 99.8 /100 | #24 | Exceptional 10.6% |