Mongolian vs Eastern European Seniors Poverty Over the Age of 75
COMPARE
Mongolian
Eastern European
Seniors Poverty Over the Age of 75
Seniors Poverty Over the Age of 75 Comparison
Mongolians
Eastern Europeans
12.2%
SENIORS POVERTY OVER THE AGE OF 75
45.5/ 100
METRIC RATING
179th/ 347
METRIC RANK
11.3%
SENIORS POVERTY OVER THE AGE OF 75
97.7/ 100
METRIC RATING
60th/ 347
METRIC RANK
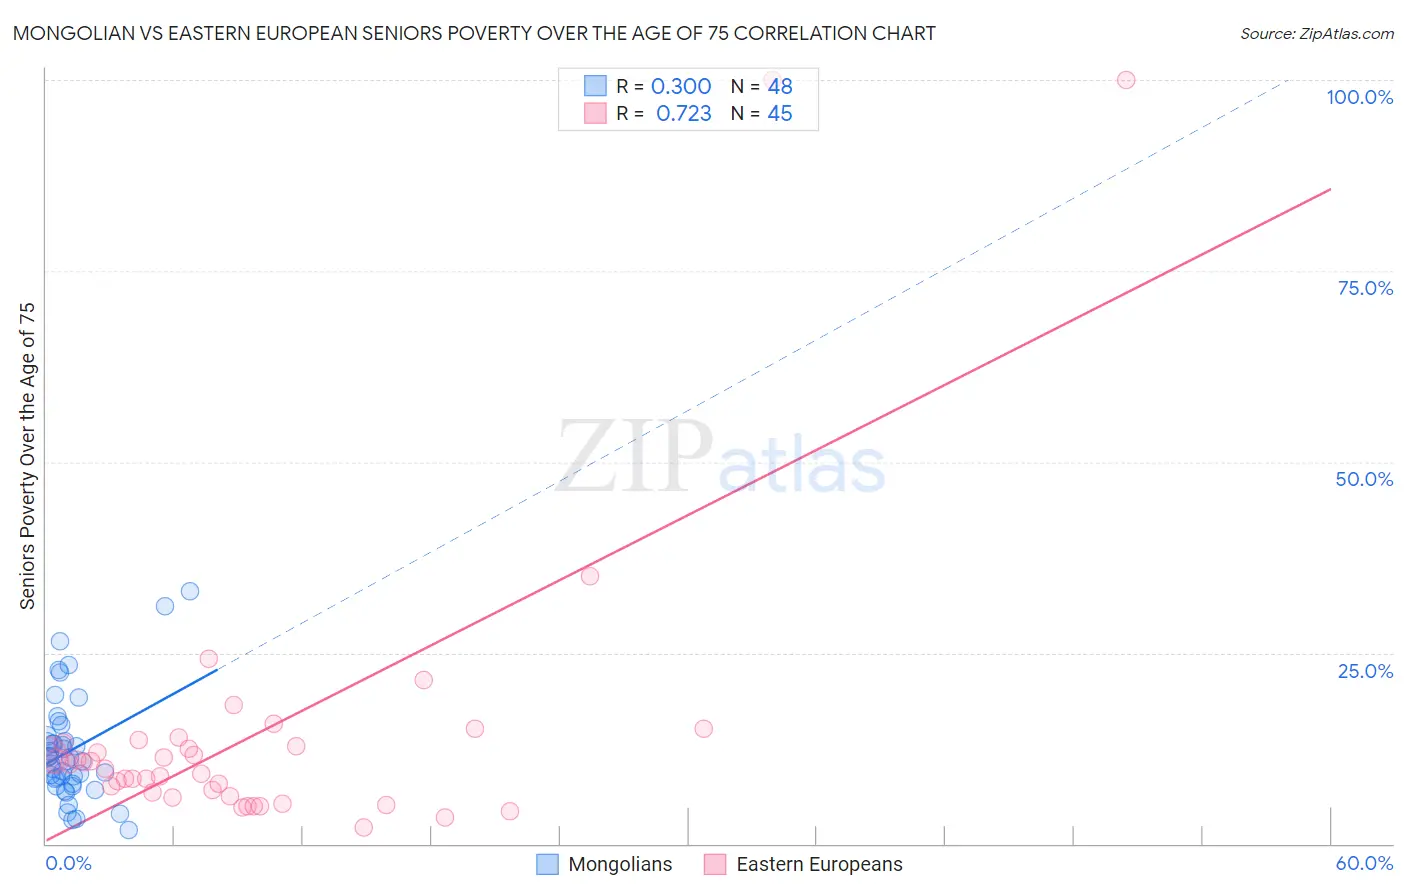
Mongolian vs Eastern European Seniors Poverty Over the Age of 75 Correlation Chart
The statistical analysis conducted on geographies consisting of 139,832,325 people shows a weak positive correlation between the proportion of Mongolians and poverty level among seniors over the age of 75 in the United States with a correlation coefficient (R) of 0.300 and weighted average of 12.2%. Similarly, the statistical analysis conducted on geographies consisting of 453,578,992 people shows a strong positive correlation between the proportion of Eastern Europeans and poverty level among seniors over the age of 75 in the United States with a correlation coefficient (R) of 0.723 and weighted average of 11.3%, a difference of 8.6%.
Seniors Poverty Over the Age of 75 Correlation Summary
| Measurement | Mongolian | Eastern European |
| Minimum | 1.9% | 2.1% |
| Maximum | 33.1% | 100.0% |
| Range | 31.3% | 97.9% |
| Mean | 12.2% | 14.5% |
| Median | 11.0% | 10.4% |
| Interquartile 25% (IQ1) | 8.2% | 6.5% |
| Interquartile 75% (IQ3) | 13.7% | 13.4% |
| Interquartile Range (IQR) | 5.5% | 6.9% |
| Standard Deviation (Sample) | 6.8% | 19.6% |
| Standard Deviation (Population) | 6.8% | 19.3% |
Similar Demographics by Seniors Poverty Over the Age of 75
Demographics Similar to Mongolians by Seniors Poverty Over the Age of 75
In terms of seniors poverty over the age of 75, the demographic groups most similar to Mongolians are Immigrants from South Eastern Asia (12.2%, a difference of 0.10%), Nonimmigrants (12.2%, a difference of 0.11%), Immigrants from Australia (12.2%, a difference of 0.11%), Immigrants from Asia (12.2%, a difference of 0.19%), and Immigrants from Iran (12.2%, a difference of 0.21%).
| Demographics | Rating | Rank | Seniors Poverty Over the Age of 75 |
| Immigrants | Fiji | 51.5 /100 | #172 | Average 12.2% |
| Arabs | 50.5 /100 | #173 | Average 12.2% |
| Immigrants | Europe | 50.0 /100 | #174 | Average 12.2% |
| Immigrants | Saudi Arabia | 49.5 /100 | #175 | Average 12.2% |
| Immigrants | Iran | 48.1 /100 | #176 | Average 12.2% |
| Immigrants | Asia | 47.8 /100 | #177 | Average 12.2% |
| Immigrants | Nonimmigrants | 46.8 /100 | #178 | Average 12.2% |
| Mongolians | 45.5 /100 | #179 | Average 12.2% |
| Immigrants | South Eastern Asia | 44.3 /100 | #180 | Average 12.2% |
| Immigrants | Australia | 44.2 /100 | #181 | Average 12.2% |
| German Russians | 41.4 /100 | #182 | Average 12.3% |
| Laotians | 38.2 /100 | #183 | Fair 12.3% |
| Kiowa | 36.0 /100 | #184 | Fair 12.3% |
| Immigrants | Malaysia | 35.8 /100 | #185 | Fair 12.3% |
| Sri Lankans | 32.3 /100 | #186 | Fair 12.4% |
Demographics Similar to Eastern Europeans by Seniors Poverty Over the Age of 75
In terms of seniors poverty over the age of 75, the demographic groups most similar to Eastern Europeans are Canadian (11.3%, a difference of 0.030%), Immigrants from Netherlands (11.2%, a difference of 0.11%), Immigrants from North America (11.3%, a difference of 0.13%), Immigrants from Afghanistan (11.3%, a difference of 0.17%), and Yugoslavian (11.2%, a difference of 0.20%).
| Demographics | Rating | Rank | Seniors Poverty Over the Age of 75 |
| Immigrants | England | 98.4 /100 | #53 | Exceptional 11.2% |
| Afghans | 98.2 /100 | #54 | Exceptional 11.2% |
| Hungarians | 98.1 /100 | #55 | Exceptional 11.2% |
| Slavs | 98.1 /100 | #56 | Exceptional 11.2% |
| Immigrants | Canada | 97.9 /100 | #57 | Exceptional 11.2% |
| Yugoslavians | 97.9 /100 | #58 | Exceptional 11.2% |
| Immigrants | Netherlands | 97.8 /100 | #59 | Exceptional 11.2% |
| Eastern Europeans | 97.7 /100 | #60 | Exceptional 11.3% |
| Canadians | 97.7 /100 | #61 | Exceptional 11.3% |
| Immigrants | North America | 97.6 /100 | #62 | Exceptional 11.3% |
| Immigrants | Afghanistan | 97.5 /100 | #63 | Exceptional 11.3% |
| Immigrants | Northern Europe | 97.4 /100 | #64 | Exceptional 11.3% |
| Immigrants | Taiwan | 96.7 /100 | #65 | Exceptional 11.4% |
| Estonians | 96.7 /100 | #66 | Exceptional 11.4% |
| Bolivians | 96.5 /100 | #67 | Exceptional 11.4% |