Mexican vs Houma Receiving Food Stamps
COMPARE
Mexican
Houma
Receiving Food Stamps
Receiving Food Stamps Comparison
Mexicans
Houma
14.6%
RECEIVING FOOD STAMPS
0.1/ 100
METRIC RATING
270th/ 347
METRIC RANK
16.5%
RECEIVING FOOD STAMPS
0.0/ 100
METRIC RATING
307th/ 347
METRIC RANK
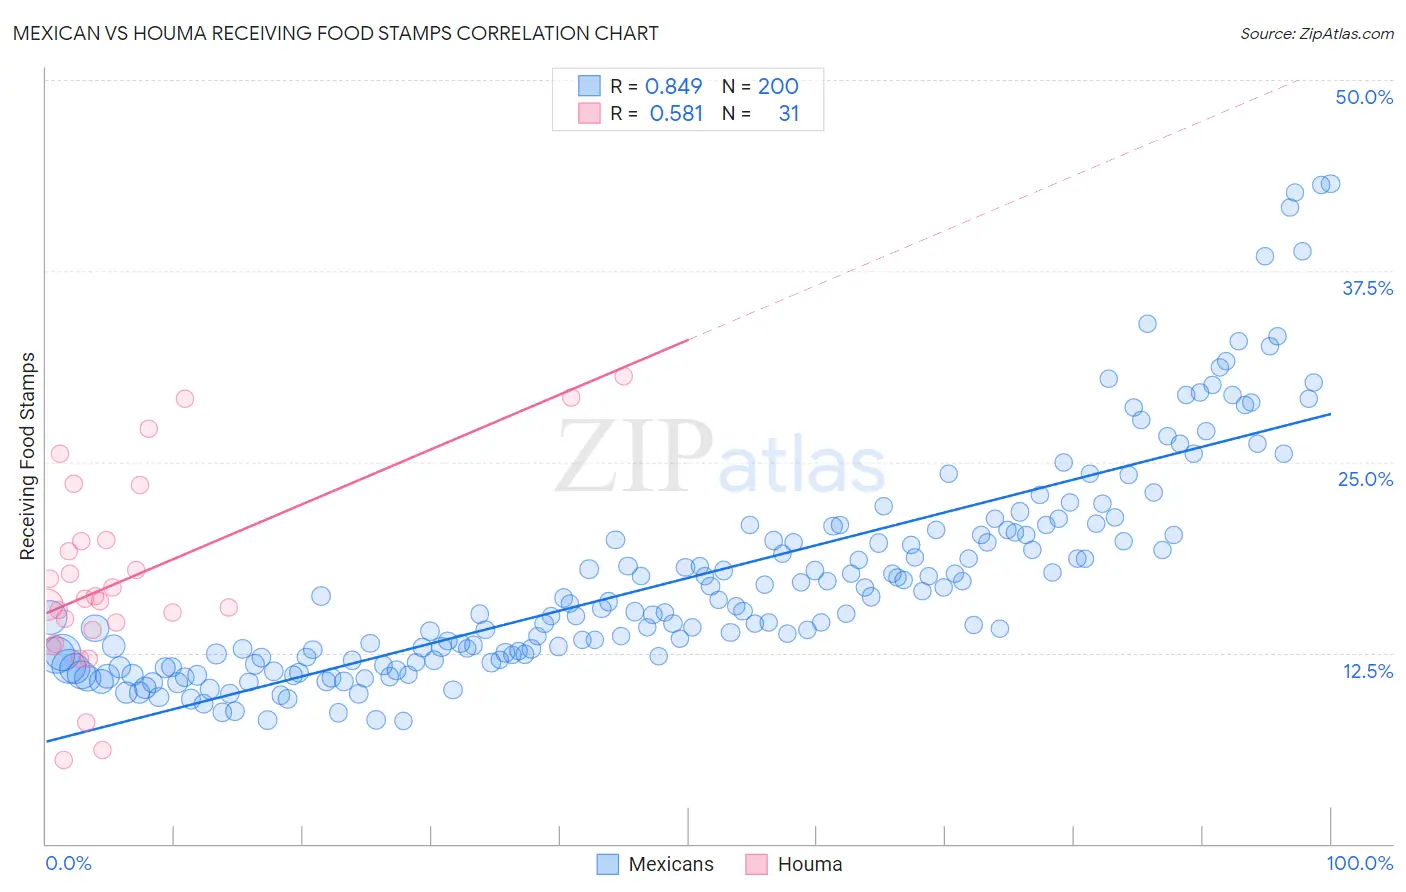
Mexican vs Houma Receiving Food Stamps Correlation Chart
The statistical analysis conducted on geographies consisting of 562,221,656 people shows a very strong positive correlation between the proportion of Mexicans and percentage of population receiving government assistance and/or food stamps in the United States with a correlation coefficient (R) of 0.849 and weighted average of 14.6%. Similarly, the statistical analysis conducted on geographies consisting of 36,773,946 people shows a substantial positive correlation between the proportion of Houma and percentage of population receiving government assistance and/or food stamps in the United States with a correlation coefficient (R) of 0.581 and weighted average of 16.5%, a difference of 12.4%.
Receiving Food Stamps Correlation Summary
| Measurement | Mexican | Houma |
| Minimum | 8.0% | 5.5% |
| Maximum | 43.2% | 30.6% |
| Range | 35.2% | 25.1% |
| Mean | 17.4% | 17.4% |
| Median | 15.2% | 16.0% |
| Interquartile 25% (IQ1) | 12.1% | 14.0% |
| Interquartile 75% (IQ3) | 20.3% | 19.9% |
| Interquartile Range (IQR) | 8.2% | 5.9% |
| Standard Deviation (Sample) | 7.3% | 6.3% |
| Standard Deviation (Population) | 7.3% | 6.2% |
Similar Demographics by Receiving Food Stamps
Demographics Similar to Mexicans by Receiving Food Stamps
In terms of receiving food stamps, the demographic groups most similar to Mexicans are Immigrants from Guatemala (14.6%, a difference of 0.090%), Nepalese (14.6%, a difference of 0.20%), Chippewa (14.7%, a difference of 0.32%), Alaskan Athabascan (14.7%, a difference of 0.35%), and Immigrants from Western Africa (14.7%, a difference of 0.36%).
| Demographics | Rating | Rank | Receiving Food Stamps |
| Immigrants | Portugal | 0.2 /100 | #263 | Tragic 14.3% |
| Immigrants | Uzbekistan | 0.2 /100 | #264 | Tragic 14.3% |
| Blackfeet | 0.2 /100 | #265 | Tragic 14.3% |
| Cheyenne | 0.2 /100 | #266 | Tragic 14.3% |
| Dutch West Indians | 0.2 /100 | #267 | Tragic 14.3% |
| Guatemalans | 0.1 /100 | #268 | Tragic 14.4% |
| Nepalese | 0.1 /100 | #269 | Tragic 14.6% |
| Mexicans | 0.1 /100 | #270 | Tragic 14.6% |
| Immigrants | Guatemala | 0.1 /100 | #271 | Tragic 14.6% |
| Chippewa | 0.1 /100 | #272 | Tragic 14.7% |
| Alaskan Athabascans | 0.1 /100 | #273 | Tragic 14.7% |
| Immigrants | Western Africa | 0.1 /100 | #274 | Tragic 14.7% |
| Ute | 0.1 /100 | #275 | Tragic 14.7% |
| Liberians | 0.1 /100 | #276 | Tragic 14.8% |
| Seminole | 0.1 /100 | #277 | Tragic 14.8% |
Demographics Similar to Houma by Receiving Food Stamps
In terms of receiving food stamps, the demographic groups most similar to Houma are Barbadian (16.5%, a difference of 0.26%), Jamaican (16.4%, a difference of 0.29%), Immigrants from the Azores (16.4%, a difference of 0.35%), U.S. Virgin Islander (16.5%, a difference of 0.50%), and Immigrants from Barbados (16.6%, a difference of 1.1%).
| Demographics | Rating | Rank | Receiving Food Stamps |
| Immigrants | Bangladesh | 0.0 /100 | #300 | Tragic 15.9% |
| Trinidadians and Tobagonians | 0.0 /100 | #301 | Tragic 16.0% |
| Immigrants | West Indies | 0.0 /100 | #302 | Tragic 16.1% |
| Nicaraguans | 0.0 /100 | #303 | Tragic 16.1% |
| West Indians | 0.0 /100 | #304 | Tragic 16.3% |
| Immigrants | Azores | 0.0 /100 | #305 | Tragic 16.4% |
| Jamaicans | 0.0 /100 | #306 | Tragic 16.4% |
| Houma | 0.0 /100 | #307 | Tragic 16.5% |
| Barbadians | 0.0 /100 | #308 | Tragic 16.5% |
| U.S. Virgin Islanders | 0.0 /100 | #309 | Tragic 16.5% |
| Immigrants | Barbados | 0.0 /100 | #310 | Tragic 16.6% |
| Guyanese | 0.0 /100 | #311 | Tragic 16.7% |
| Sioux | 0.0 /100 | #312 | Tragic 16.8% |
| Immigrants | Jamaica | 0.0 /100 | #313 | Tragic 16.9% |
| Immigrants | Guyana | 0.0 /100 | #314 | Tragic 16.9% |