Mexican vs Chilean Seniors Poverty Over the Age of 75
COMPARE
Mexican
Chilean
Seniors Poverty Over the Age of 75
Seniors Poverty Over the Age of 75 Comparison
Mexicans
Chileans
14.4%
SENIORS POVERTY OVER THE AGE OF 75
0.0/ 100
METRIC RATING
272nd/ 347
METRIC RANK
12.6%
SENIORS POVERTY OVER THE AGE OF 75
13.7/ 100
METRIC RATING
198th/ 347
METRIC RANK
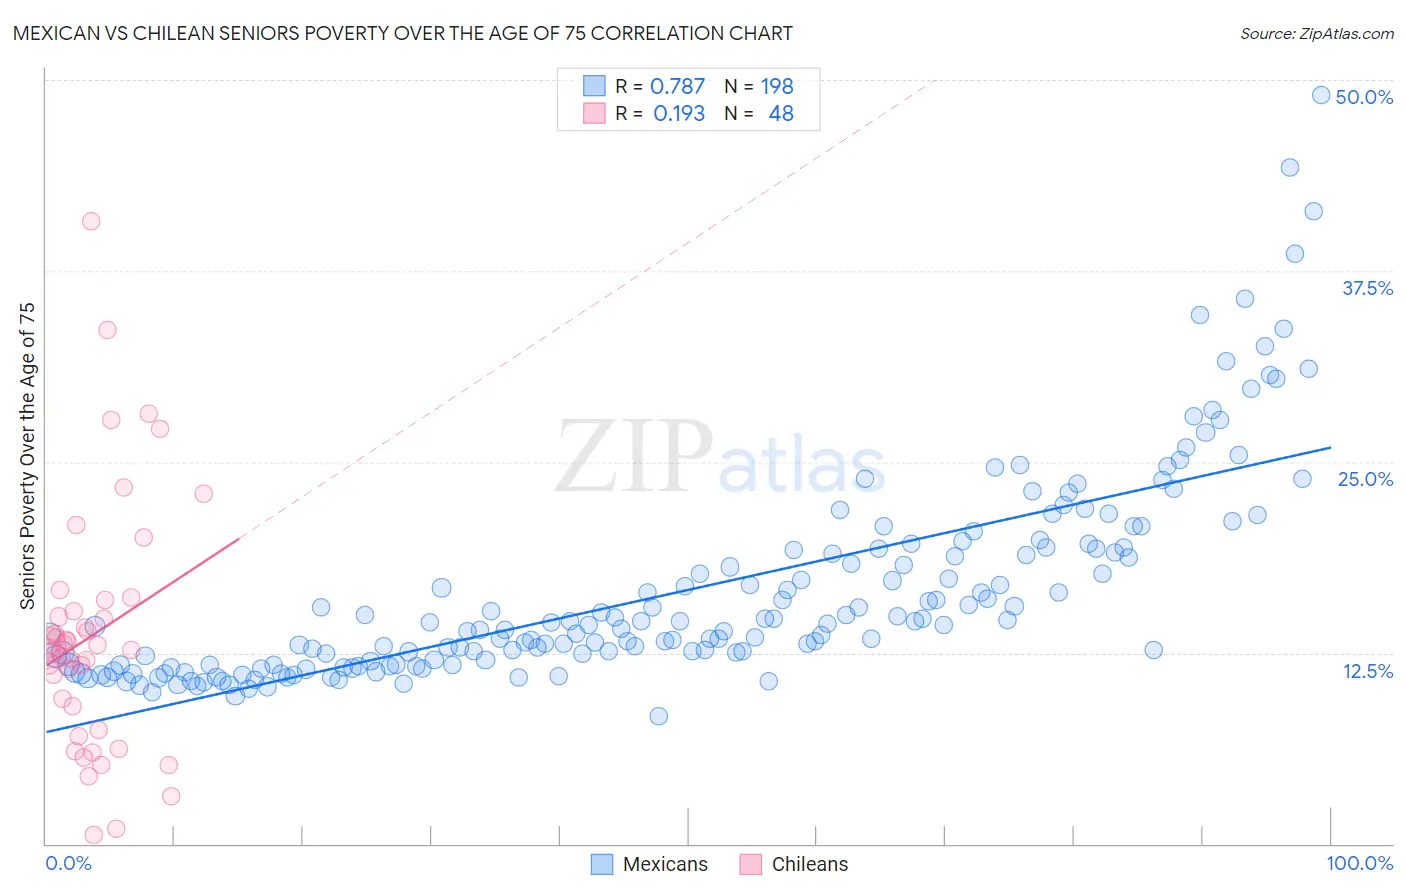
Mexican vs Chilean Seniors Poverty Over the Age of 75 Correlation Chart
The statistical analysis conducted on geographies consisting of 549,837,754 people shows a strong positive correlation between the proportion of Mexicans and poverty level among seniors over the age of 75 in the United States with a correlation coefficient (R) of 0.787 and weighted average of 14.4%. Similarly, the statistical analysis conducted on geographies consisting of 254,835,518 people shows a poor positive correlation between the proportion of Chileans and poverty level among seniors over the age of 75 in the United States with a correlation coefficient (R) of 0.193 and weighted average of 12.6%, a difference of 13.7%.
Seniors Poverty Over the Age of 75 Correlation Summary
| Measurement | Mexican | Chilean |
| Minimum | 8.4% | 0.54% |
| Maximum | 49.0% | 40.7% |
| Range | 40.7% | 40.2% |
| Mean | 16.5% | 13.7% |
| Median | 14.3% | 12.9% |
| Interquartile 25% (IQ1) | 11.7% | 8.2% |
| Interquartile 75% (IQ3) | 19.3% | 15.6% |
| Interquartile Range (IQR) | 7.5% | 7.4% |
| Standard Deviation (Sample) | 6.8% | 8.1% |
| Standard Deviation (Population) | 6.8% | 8.0% |
Similar Demographics by Seniors Poverty Over the Age of 75
Demographics Similar to Mexicans by Seniors Poverty Over the Age of 75
In terms of seniors poverty over the age of 75, the demographic groups most similar to Mexicans are Immigrants from Ghana (14.4%, a difference of 0.11%), Immigrants from South America (14.4%, a difference of 0.22%), Immigrants from Bahamas (14.4%, a difference of 0.39%), Immigrants from El Salvador (14.5%, a difference of 0.55%), and Immigrants from Uruguay (14.3%, a difference of 0.59%).
| Demographics | Rating | Rank | Seniors Poverty Over the Age of 75 |
| Salvadorans | 0.0 /100 | #265 | Tragic 14.2% |
| Armenians | 0.0 /100 | #266 | Tragic 14.2% |
| Venezuelans | 0.0 /100 | #267 | Tragic 14.2% |
| Colombians | 0.0 /100 | #268 | Tragic 14.3% |
| Immigrants | Venezuela | 0.0 /100 | #269 | Tragic 14.3% |
| Immigrants | Uruguay | 0.0 /100 | #270 | Tragic 14.3% |
| Immigrants | Ghana | 0.0 /100 | #271 | Tragic 14.4% |
| Mexicans | 0.0 /100 | #272 | Tragic 14.4% |
| Immigrants | South America | 0.0 /100 | #273 | Tragic 14.4% |
| Immigrants | Bahamas | 0.0 /100 | #274 | Tragic 14.4% |
| Immigrants | El Salvador | 0.0 /100 | #275 | Tragic 14.5% |
| Soviet Union | 0.0 /100 | #276 | Tragic 14.5% |
| Senegalese | 0.0 /100 | #277 | Tragic 14.5% |
| Immigrants | Colombia | 0.0 /100 | #278 | Tragic 14.6% |
| Blacks/African Americans | 0.0 /100 | #279 | Tragic 14.6% |
Demographics Similar to Chileans by Seniors Poverty Over the Age of 75
In terms of seniors poverty over the age of 75, the demographic groups most similar to Chileans are Nepalese (12.6%, a difference of 0.11%), Immigrants from Lebanon (12.7%, a difference of 0.17%), Immigrants from Vietnam (12.7%, a difference of 0.27%), Immigrants from Eastern Europe (12.6%, a difference of 0.37%), and Paraguayan (12.7%, a difference of 0.47%).
| Demographics | Rating | Rank | Seniors Poverty Over the Age of 75 |
| Liberians | 23.2 /100 | #191 | Fair 12.5% |
| Choctaw | 20.2 /100 | #192 | Fair 12.5% |
| Taiwanese | 17.8 /100 | #193 | Poor 12.6% |
| Alsatians | 17.7 /100 | #194 | Poor 12.6% |
| Immigrants | France | 17.4 /100 | #195 | Poor 12.6% |
| Immigrants | Eastern Europe | 16.0 /100 | #196 | Poor 12.6% |
| Nepalese | 14.4 /100 | #197 | Poor 12.6% |
| Chileans | 13.7 /100 | #198 | Poor 12.6% |
| Immigrants | Lebanon | 12.7 /100 | #199 | Poor 12.7% |
| Immigrants | Vietnam | 12.1 /100 | #200 | Poor 12.7% |
| Paraguayans | 11.1 /100 | #201 | Poor 12.7% |
| Arapaho | 10.9 /100 | #202 | Poor 12.7% |
| Immigrants | Southern Europe | 10.7 /100 | #203 | Poor 12.7% |
| Immigrants | Eritrea | 10.5 /100 | #204 | Poor 12.7% |
| Indians (Asian) | 9.7 /100 | #205 | Tragic 12.7% |