Immigrants from Caribbean vs Chilean Seniors Poverty Over the Age of 75
COMPARE
Immigrants from Caribbean
Chilean
Seniors Poverty Over the Age of 75
Seniors Poverty Over the Age of 75 Comparison
Immigrants from Caribbean
Chileans
18.2%
SENIORS POVERTY OVER THE AGE OF 75
0.0/ 100
METRIC RATING
336th/ 347
METRIC RANK
12.6%
SENIORS POVERTY OVER THE AGE OF 75
13.7/ 100
METRIC RATING
198th/ 347
METRIC RANK
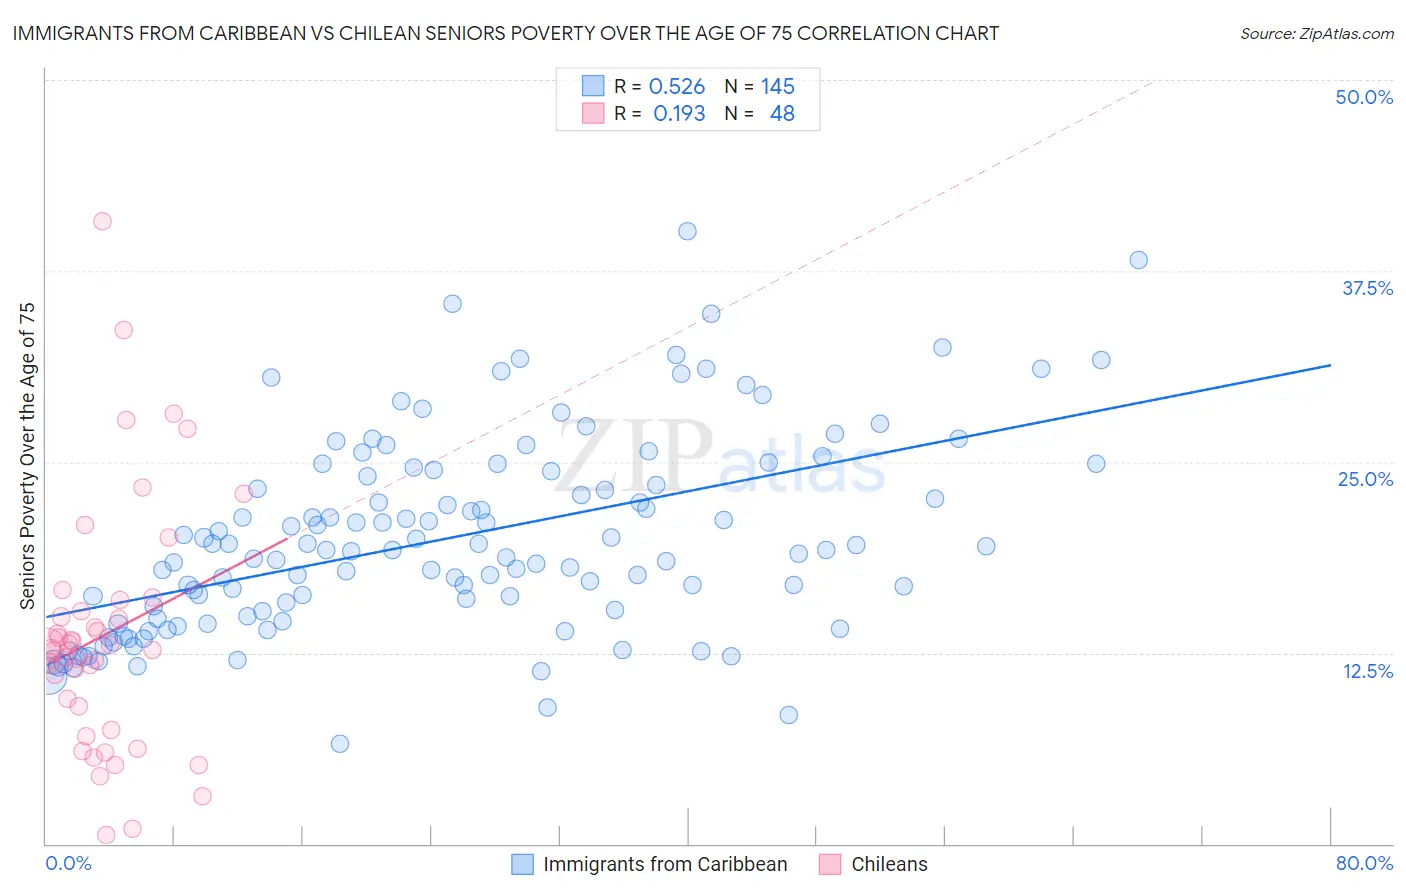
Immigrants from Caribbean vs Chilean Seniors Poverty Over the Age of 75 Correlation Chart
The statistical analysis conducted on geographies consisting of 443,355,794 people shows a substantial positive correlation between the proportion of Immigrants from Caribbean and poverty level among seniors over the age of 75 in the United States with a correlation coefficient (R) of 0.526 and weighted average of 18.2%. Similarly, the statistical analysis conducted on geographies consisting of 254,835,518 people shows a poor positive correlation between the proportion of Chileans and poverty level among seniors over the age of 75 in the United States with a correlation coefficient (R) of 0.193 and weighted average of 12.6%, a difference of 44.3%.
Seniors Poverty Over the Age of 75 Correlation Summary
| Measurement | Immigrants from Caribbean | Chilean |
| Minimum | 6.6% | 0.54% |
| Maximum | 40.1% | 40.7% |
| Range | 33.5% | 40.2% |
| Mean | 19.9% | 13.7% |
| Median | 19.2% | 12.9% |
| Interquartile 25% (IQ1) | 14.8% | 8.2% |
| Interquartile 75% (IQ3) | 24.2% | 15.6% |
| Interquartile Range (IQR) | 9.4% | 7.4% |
| Standard Deviation (Sample) | 6.4% | 8.1% |
| Standard Deviation (Population) | 6.4% | 8.0% |
Similar Demographics by Seniors Poverty Over the Age of 75
Demographics Similar to Immigrants from Caribbean by Seniors Poverty Over the Age of 75
In terms of seniors poverty over the age of 75, the demographic groups most similar to Immigrants from Caribbean are Yakama (18.3%, a difference of 0.40%), Immigrants from Cabo Verde (18.5%, a difference of 1.4%), Cuban (18.0%, a difference of 1.6%), Immigrants from Grenada (17.8%, a difference of 2.2%), and Hopi (18.9%, a difference of 3.4%).
| Demographics | Rating | Rank | Seniors Poverty Over the Age of 75 |
| Immigrants | Dominica | 0.0 /100 | #329 | Tragic 17.0% |
| British West Indians | 0.0 /100 | #330 | Tragic 17.4% |
| Immigrants | Armenia | 0.0 /100 | #331 | Tragic 17.5% |
| Immigrants | St. Vincent and the Grenadines | 0.0 /100 | #332 | Tragic 17.5% |
| Immigrants | Nicaragua | 0.0 /100 | #333 | Tragic 17.6% |
| Immigrants | Grenada | 0.0 /100 | #334 | Tragic 17.8% |
| Cubans | 0.0 /100 | #335 | Tragic 18.0% |
| Immigrants | Caribbean | 0.0 /100 | #336 | Tragic 18.2% |
| Yakama | 0.0 /100 | #337 | Tragic 18.3% |
| Immigrants | Cabo Verde | 0.0 /100 | #338 | Tragic 18.5% |
| Hopi | 0.0 /100 | #339 | Tragic 18.9% |
| Tohono O'odham | 0.0 /100 | #340 | Tragic 19.1% |
| Navajo | 0.0 /100 | #341 | Tragic 19.4% |
| Dominicans | 0.0 /100 | #342 | Tragic 19.6% |
| Lumbee | 0.0 /100 | #343 | Tragic 19.7% |
Demographics Similar to Chileans by Seniors Poverty Over the Age of 75
In terms of seniors poverty over the age of 75, the demographic groups most similar to Chileans are Nepalese (12.6%, a difference of 0.11%), Immigrants from Lebanon (12.7%, a difference of 0.17%), Immigrants from Vietnam (12.7%, a difference of 0.27%), Immigrants from Eastern Europe (12.6%, a difference of 0.37%), and Paraguayan (12.7%, a difference of 0.47%).
| Demographics | Rating | Rank | Seniors Poverty Over the Age of 75 |
| Liberians | 23.2 /100 | #191 | Fair 12.5% |
| Choctaw | 20.2 /100 | #192 | Fair 12.5% |
| Taiwanese | 17.8 /100 | #193 | Poor 12.6% |
| Alsatians | 17.7 /100 | #194 | Poor 12.6% |
| Immigrants | France | 17.4 /100 | #195 | Poor 12.6% |
| Immigrants | Eastern Europe | 16.0 /100 | #196 | Poor 12.6% |
| Nepalese | 14.4 /100 | #197 | Poor 12.6% |
| Chileans | 13.7 /100 | #198 | Poor 12.6% |
| Immigrants | Lebanon | 12.7 /100 | #199 | Poor 12.7% |
| Immigrants | Vietnam | 12.1 /100 | #200 | Poor 12.7% |
| Paraguayans | 11.1 /100 | #201 | Poor 12.7% |
| Arapaho | 10.9 /100 | #202 | Poor 12.7% |
| Immigrants | Southern Europe | 10.7 /100 | #203 | Poor 12.7% |
| Immigrants | Eritrea | 10.5 /100 | #204 | Poor 12.7% |
| Indians (Asian) | 9.7 /100 | #205 | Tragic 12.7% |