Mexican American Indian vs Immigrants from Ghana Seniors Poverty Over the Age of 65
COMPARE
Mexican American Indian
Immigrants from Ghana
Seniors Poverty Over the Age of 65
Seniors Poverty Over the Age of 65 Comparison
Mexican American Indians
Immigrants from Ghana
12.4%
SENIORS POVERTY OVER THE AGE OF 65
0.3/ 100
METRIC RATING
255th/ 347
METRIC RANK
12.8%
SENIORS POVERTY OVER THE AGE OF 65
0.1/ 100
METRIC RATING
271st/ 347
METRIC RANK
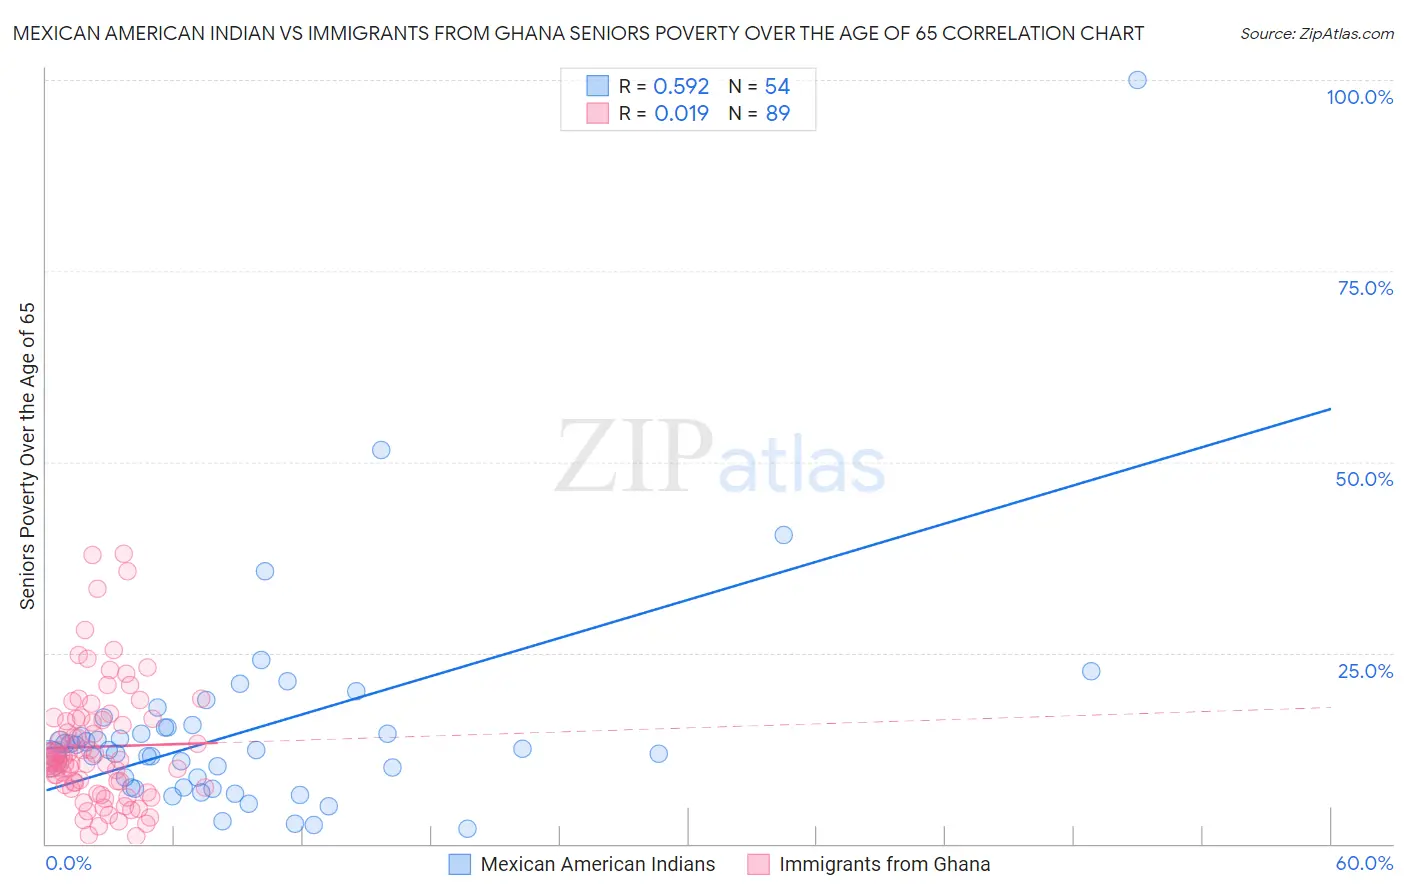
Mexican American Indian vs Immigrants from Ghana Seniors Poverty Over the Age of 65 Correlation Chart
The statistical analysis conducted on geographies consisting of 316,752,558 people shows a substantial positive correlation between the proportion of Mexican American Indians and poverty level among seniors over the age of 65 in the United States with a correlation coefficient (R) of 0.592 and weighted average of 12.4%. Similarly, the statistical analysis conducted on geographies consisting of 199,289,505 people shows no correlation between the proportion of Immigrants from Ghana and poverty level among seniors over the age of 65 in the United States with a correlation coefficient (R) of 0.019 and weighted average of 12.8%, a difference of 3.1%.
Seniors Poverty Over the Age of 65 Correlation Summary
| Measurement | Mexican American Indian | Immigrants from Ghana |
| Minimum | 2.0% | 1.0% |
| Maximum | 100.0% | 38.0% |
| Range | 98.0% | 37.0% |
| Mean | 15.1% | 12.7% |
| Median | 12.3% | 11.0% |
| Interquartile 25% (IQ1) | 7.4% | 7.5% |
| Interquartile 75% (IQ3) | 15.3% | 16.4% |
| Interquartile Range (IQR) | 7.8% | 8.9% |
| Standard Deviation (Sample) | 14.8% | 7.8% |
| Standard Deviation (Population) | 14.6% | 7.8% |
Demographics Similar to Mexican American Indians and Immigrants from Ghana by Seniors Poverty Over the Age of 65
In terms of seniors poverty over the age of 65, the demographic groups most similar to Mexican American Indians are Immigrants from Cambodia (12.4%, a difference of 0.13%), Immigrants from Panama (12.4%, a difference of 0.23%), Immigrants (12.4%, a difference of 0.24%), Shoshone (12.3%, a difference of 0.34%), and Dutch West Indian (12.4%, a difference of 0.49%). Similarly, the demographic groups most similar to Immigrants from Ghana are Immigrants from Uruguay (12.8%, a difference of 0.030%), Kiowa (12.8%, a difference of 0.15%), Immigrants from South America (12.7%, a difference of 0.27%), Immigrants from Venezuela (12.7%, a difference of 0.52%), and Immigrants from Somalia (12.6%, a difference of 1.1%).
| Demographics | Rating | Rank | Seniors Poverty Over the Age of 65 |
| Shoshone | 0.3 /100 | #253 | Tragic 12.3% |
| Immigrants | Cambodia | 0.3 /100 | #254 | Tragic 12.4% |
| Mexican American Indians | 0.3 /100 | #255 | Tragic 12.4% |
| Immigrants | Panama | 0.2 /100 | #256 | Tragic 12.4% |
| Immigrants | Immigrants | 0.2 /100 | #257 | Tragic 12.4% |
| Dutch West Indians | 0.2 /100 | #258 | Tragic 12.4% |
| Ghanaians | 0.2 /100 | #259 | Tragic 12.4% |
| South Americans | 0.2 /100 | #260 | Tragic 12.5% |
| Colombians | 0.2 /100 | #261 | Tragic 12.5% |
| Venezuelans | 0.1 /100 | #262 | Tragic 12.5% |
| Soviet Union | 0.1 /100 | #263 | Tragic 12.6% |
| Inupiat | 0.1 /100 | #264 | Tragic 12.6% |
| Immigrants | Western Africa | 0.1 /100 | #265 | Tragic 12.6% |
| Africans | 0.1 /100 | #266 | Tragic 12.6% |
| Blackfeet | 0.1 /100 | #267 | Tragic 12.6% |
| Immigrants | Somalia | 0.1 /100 | #268 | Tragic 12.6% |
| Immigrants | Venezuela | 0.1 /100 | #269 | Tragic 12.7% |
| Immigrants | South America | 0.1 /100 | #270 | Tragic 12.7% |
| Immigrants | Ghana | 0.1 /100 | #271 | Tragic 12.8% |
| Immigrants | Uruguay | 0.1 /100 | #272 | Tragic 12.8% |
| Kiowa | 0.0 /100 | #273 | Tragic 12.8% |