Menominee vs Nepalese Child Poverty Under the Age of 16
COMPARE
Menominee
Nepalese
Child Poverty Under the Age of 16
Child Poverty Under the Age of 16 Comparison
Menominee
Nepalese
23.0%
CHILD POVERTY UNDER THE AGE OF 16
0.0/ 100
METRIC RATING
327th/ 347
METRIC RANK
18.2%
CHILD POVERTY UNDER THE AGE OF 16
1.7/ 100
METRIC RATING
230th/ 347
METRIC RANK
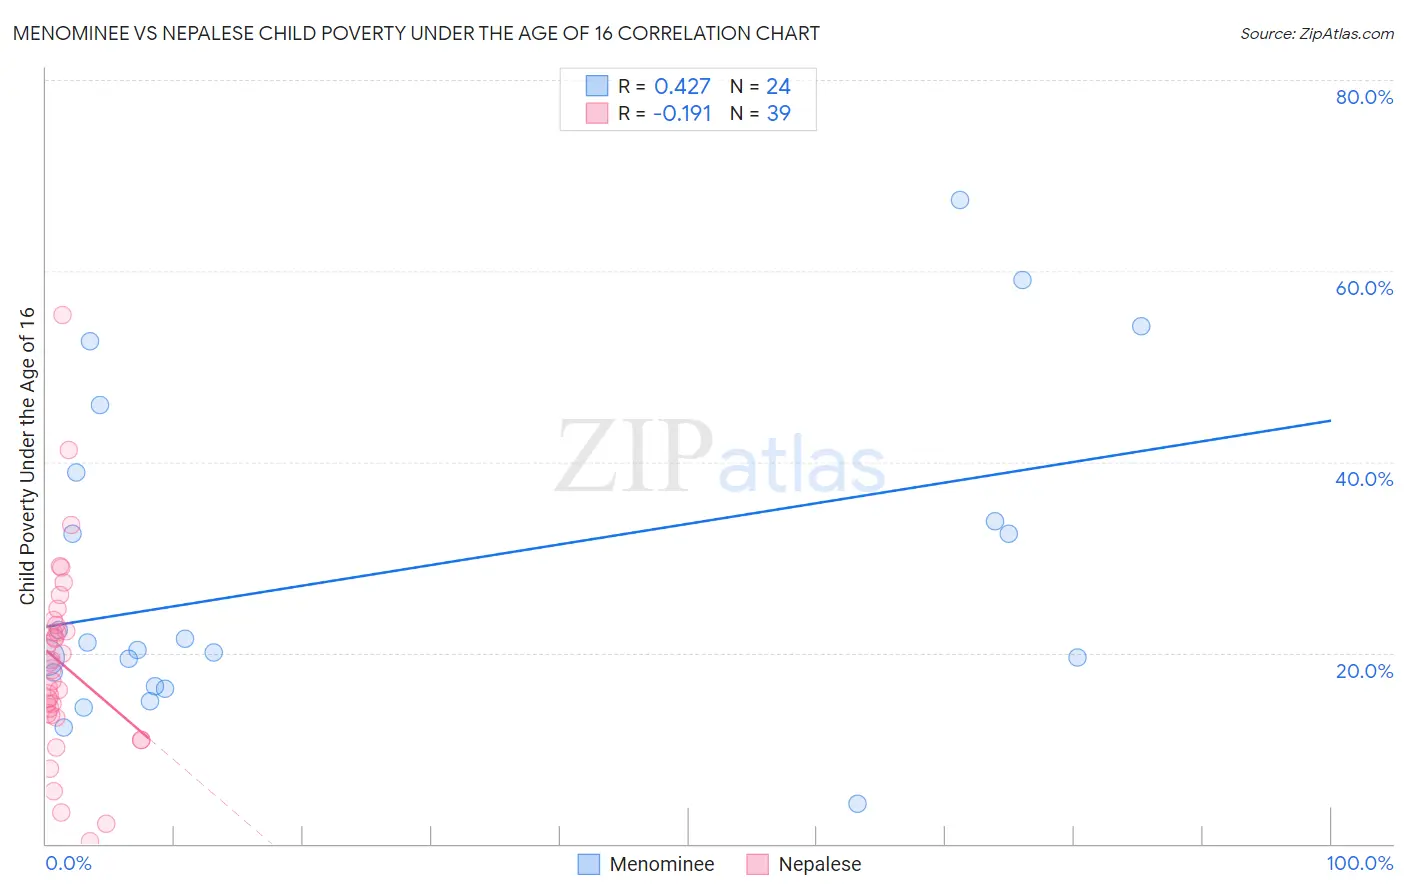
Menominee vs Nepalese Child Poverty Under the Age of 16 Correlation Chart
The statistical analysis conducted on geographies consisting of 45,715,649 people shows a moderate positive correlation between the proportion of Menominee and poverty level among children under the age of 16 in the United States with a correlation coefficient (R) of 0.427 and weighted average of 23.0%. Similarly, the statistical analysis conducted on geographies consisting of 24,518,639 people shows a poor negative correlation between the proportion of Nepalese and poverty level among children under the age of 16 in the United States with a correlation coefficient (R) of -0.191 and weighted average of 18.2%, a difference of 26.4%.
Child Poverty Under the Age of 16 Correlation Summary
| Measurement | Menominee | Nepalese |
| Minimum | 4.2% | 0.33% |
| Maximum | 67.4% | 55.4% |
| Range | 63.2% | 55.1% |
| Mean | 28.2% | 18.8% |
| Median | 20.7% | 18.3% |
| Interquartile 25% (IQ1) | 17.3% | 13.5% |
| Interquartile 75% (IQ3) | 36.4% | 22.9% |
| Interquartile Range (IQR) | 19.1% | 9.4% |
| Standard Deviation (Sample) | 16.6% | 10.3% |
| Standard Deviation (Population) | 16.3% | 10.2% |
Similar Demographics by Child Poverty Under the Age of 16
Demographics Similar to Menominee by Child Poverty Under the Age of 16
In terms of child poverty under the age of 16, the demographic groups most similar to Menominee are Colville (23.0%, a difference of 0.38%), Immigrants from Honduras (22.7%, a difference of 1.1%), Immigrants from Congo (22.5%, a difference of 1.9%), Central American Indian (22.5%, a difference of 2.1%), and Paiute (22.4%, a difference of 2.4%).
| Demographics | Rating | Rank | Child Poverty Under the Age of 16 |
| Cajuns | 0.0 /100 | #320 | Tragic 22.1% |
| Kiowa | 0.0 /100 | #321 | Tragic 22.2% |
| Hondurans | 0.0 /100 | #322 | Tragic 22.2% |
| Paiute | 0.0 /100 | #323 | Tragic 22.4% |
| Central American Indians | 0.0 /100 | #324 | Tragic 22.5% |
| Immigrants | Congo | 0.0 /100 | #325 | Tragic 22.5% |
| Immigrants | Honduras | 0.0 /100 | #326 | Tragic 22.7% |
| Menominee | 0.0 /100 | #327 | Tragic 23.0% |
| Colville | 0.0 /100 | #328 | Tragic 23.0% |
| Dominicans | 0.0 /100 | #329 | Tragic 23.8% |
| Natives/Alaskans | 0.0 /100 | #330 | Tragic 23.8% |
| Apache | 0.0 /100 | #331 | Tragic 23.8% |
| Pueblo | 0.0 /100 | #332 | Tragic 23.9% |
| Immigrants | Dominican Republic | 0.0 /100 | #333 | Tragic 24.0% |
| Blacks/African Americans | 0.0 /100 | #334 | Tragic 24.4% |
Demographics Similar to Nepalese by Child Poverty Under the Age of 16
In terms of child poverty under the age of 16, the demographic groups most similar to Nepalese are Nicaraguan (18.2%, a difference of 0.060%), Marshallese (18.1%, a difference of 0.080%), Immigrants from Micronesia (18.0%, a difference of 0.81%), Immigrants from Africa (18.0%, a difference of 0.96%), and American (18.3%, a difference of 0.96%).
| Demographics | Rating | Rank | Child Poverty Under the Age of 16 |
| Immigrants | Cambodia | 3.3 /100 | #223 | Tragic 17.8% |
| Osage | 3.1 /100 | #224 | Tragic 17.9% |
| Immigrants | Nonimmigrants | 2.7 /100 | #225 | Tragic 17.9% |
| Bermudans | 2.6 /100 | #226 | Tragic 18.0% |
| Immigrants | Africa | 2.5 /100 | #227 | Tragic 18.0% |
| Immigrants | Micronesia | 2.3 /100 | #228 | Tragic 18.0% |
| Marshallese | 1.8 /100 | #229 | Tragic 18.1% |
| Nepalese | 1.7 /100 | #230 | Tragic 18.2% |
| Nicaraguans | 1.7 /100 | #231 | Tragic 18.2% |
| Americans | 1.2 /100 | #232 | Tragic 18.3% |
| Fijians | 1.1 /100 | #233 | Tragic 18.4% |
| Immigrants | Nigeria | 1.0 /100 | #234 | Tragic 18.4% |
| Nigerians | 1.0 /100 | #235 | Tragic 18.4% |
| Cree | 0.9 /100 | #236 | Tragic 18.5% |
| Sudanese | 0.9 /100 | #237 | Tragic 18.5% |