Immigrants from Thailand vs Nepalese Child Poverty Under the Age of 16
COMPARE
Immigrants from Thailand
Nepalese
Child Poverty Under the Age of 16
Child Poverty Under the Age of 16 Comparison
Immigrants from Thailand
Nepalese
17.5%
CHILD POVERTY UNDER THE AGE OF 16
6.6/ 100
METRIC RATING
211th/ 347
METRIC RANK
18.2%
CHILD POVERTY UNDER THE AGE OF 16
1.7/ 100
METRIC RATING
230th/ 347
METRIC RANK
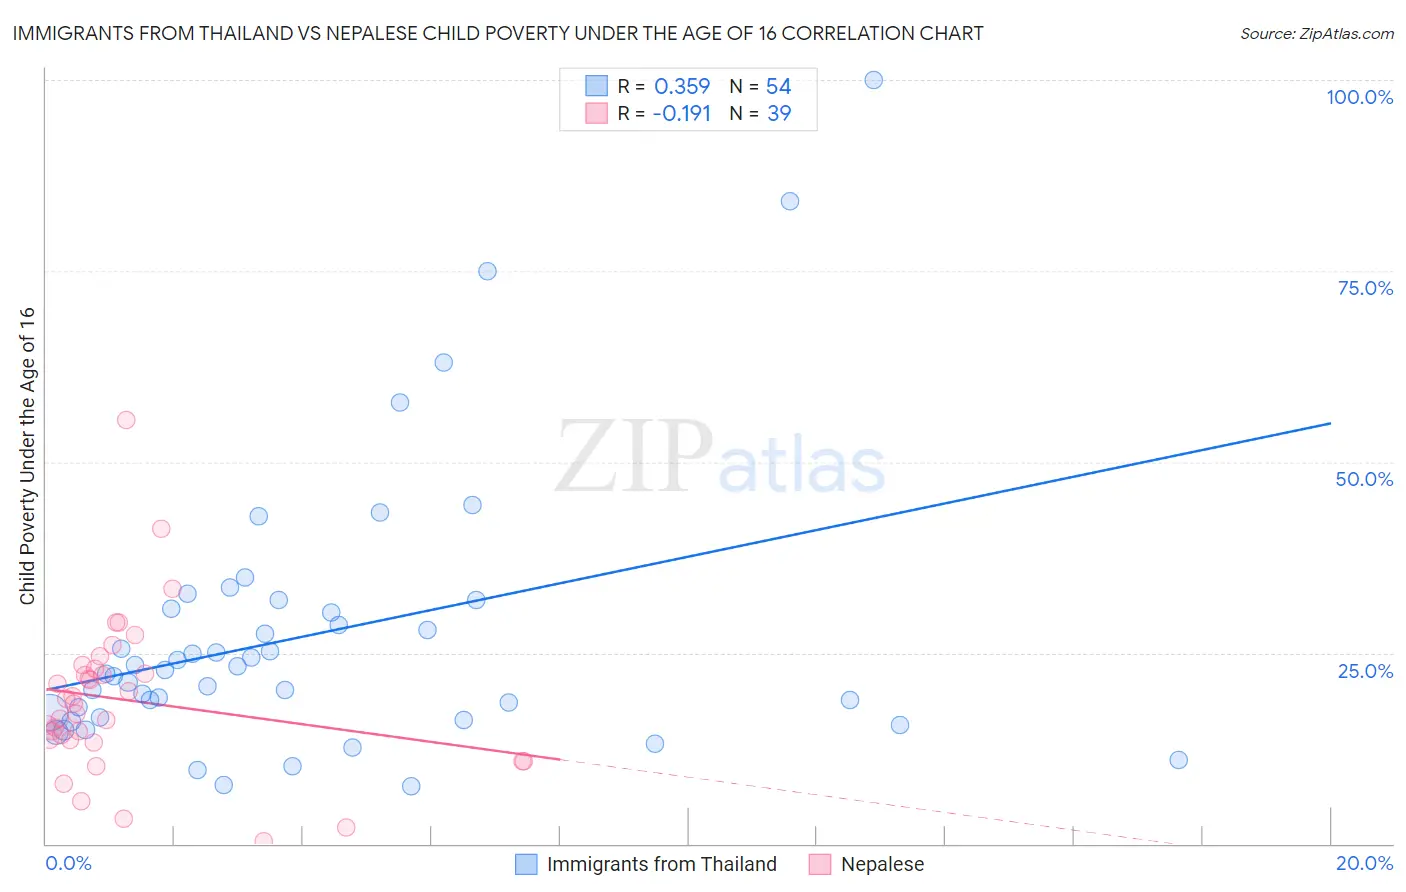
Immigrants from Thailand vs Nepalese Child Poverty Under the Age of 16 Correlation Chart
The statistical analysis conducted on geographies consisting of 315,326,373 people shows a mild positive correlation between the proportion of Immigrants from Thailand and poverty level among children under the age of 16 in the United States with a correlation coefficient (R) of 0.359 and weighted average of 17.5%. Similarly, the statistical analysis conducted on geographies consisting of 24,518,639 people shows a poor negative correlation between the proportion of Nepalese and poverty level among children under the age of 16 in the United States with a correlation coefficient (R) of -0.191 and weighted average of 18.2%, a difference of 3.8%.
Child Poverty Under the Age of 16 Correlation Summary
| Measurement | Immigrants from Thailand | Nepalese |
| Minimum | 7.5% | 0.33% |
| Maximum | 100.0% | 55.4% |
| Range | 92.5% | 55.1% |
| Mean | 27.3% | 18.8% |
| Median | 22.5% | 18.3% |
| Interquartile 25% (IQ1) | 16.5% | 13.5% |
| Interquartile 75% (IQ3) | 30.7% | 22.9% |
| Interquartile Range (IQR) | 14.2% | 9.4% |
| Standard Deviation (Sample) | 18.4% | 10.3% |
| Standard Deviation (Population) | 18.2% | 10.2% |
Demographics Similar to Immigrants from Thailand and Nepalese by Child Poverty Under the Age of 16
In terms of child poverty under the age of 16, the demographic groups most similar to Immigrants from Thailand are Immigrants (17.5%, a difference of 0.020%), Alaskan Athabascan (17.5%, a difference of 0.12%), Immigrants from the Azores (17.5%, a difference of 0.19%), Iraqi (17.5%, a difference of 0.31%), and Malaysian (17.5%, a difference of 0.33%). Similarly, the demographic groups most similar to Nepalese are Marshallese (18.1%, a difference of 0.080%), Immigrants from Micronesia (18.0%, a difference of 0.81%), Immigrants from Africa (18.0%, a difference of 0.96%), Bermudan (18.0%, a difference of 1.1%), and Nonimmigrants (17.9%, a difference of 1.2%).
| Demographics | Rating | Rank | Child Poverty Under the Age of 16 |
| Alaskan Athabascans | 6.9 /100 | #210 | Tragic 17.5% |
| Immigrants | Thailand | 6.6 /100 | #211 | Tragic 17.5% |
| Immigrants | Immigrants | 6.5 /100 | #212 | Tragic 17.5% |
| Immigrants | Azores | 6.2 /100 | #213 | Tragic 17.5% |
| Iraqis | 5.9 /100 | #214 | Tragic 17.5% |
| Malaysians | 5.9 /100 | #215 | Tragic 17.5% |
| Sierra Leoneans | 5.7 /100 | #216 | Tragic 17.6% |
| Immigrants | Eastern Africa | 5.3 /100 | #217 | Tragic 17.6% |
| Moroccans | 5.3 /100 | #218 | Tragic 17.6% |
| Japanese | 4.7 /100 | #219 | Tragic 17.7% |
| Immigrants | Panama | 4.1 /100 | #220 | Tragic 17.7% |
| Cubans | 3.7 /100 | #221 | Tragic 17.8% |
| Immigrants | Armenia | 3.6 /100 | #222 | Tragic 17.8% |
| Immigrants | Cambodia | 3.3 /100 | #223 | Tragic 17.8% |
| Osage | 3.1 /100 | #224 | Tragic 17.9% |
| Immigrants | Nonimmigrants | 2.7 /100 | #225 | Tragic 17.9% |
| Bermudans | 2.6 /100 | #226 | Tragic 18.0% |
| Immigrants | Africa | 2.5 /100 | #227 | Tragic 18.0% |
| Immigrants | Micronesia | 2.3 /100 | #228 | Tragic 18.0% |
| Marshallese | 1.8 /100 | #229 | Tragic 18.1% |
| Nepalese | 1.7 /100 | #230 | Tragic 18.2% |