Liberian vs Indian (Asian) Seniors Poverty Over the Age of 75
COMPARE
Liberian
Indian (Asian)
Seniors Poverty Over the Age of 75
Seniors Poverty Over the Age of 75 Comparison
Liberians
Indians (Asian)
12.5%
SENIORS POVERTY OVER THE AGE OF 75
23.2/ 100
METRIC RATING
191st/ 347
METRIC RANK
12.7%
SENIORS POVERTY OVER THE AGE OF 75
9.7/ 100
METRIC RATING
205th/ 347
METRIC RANK
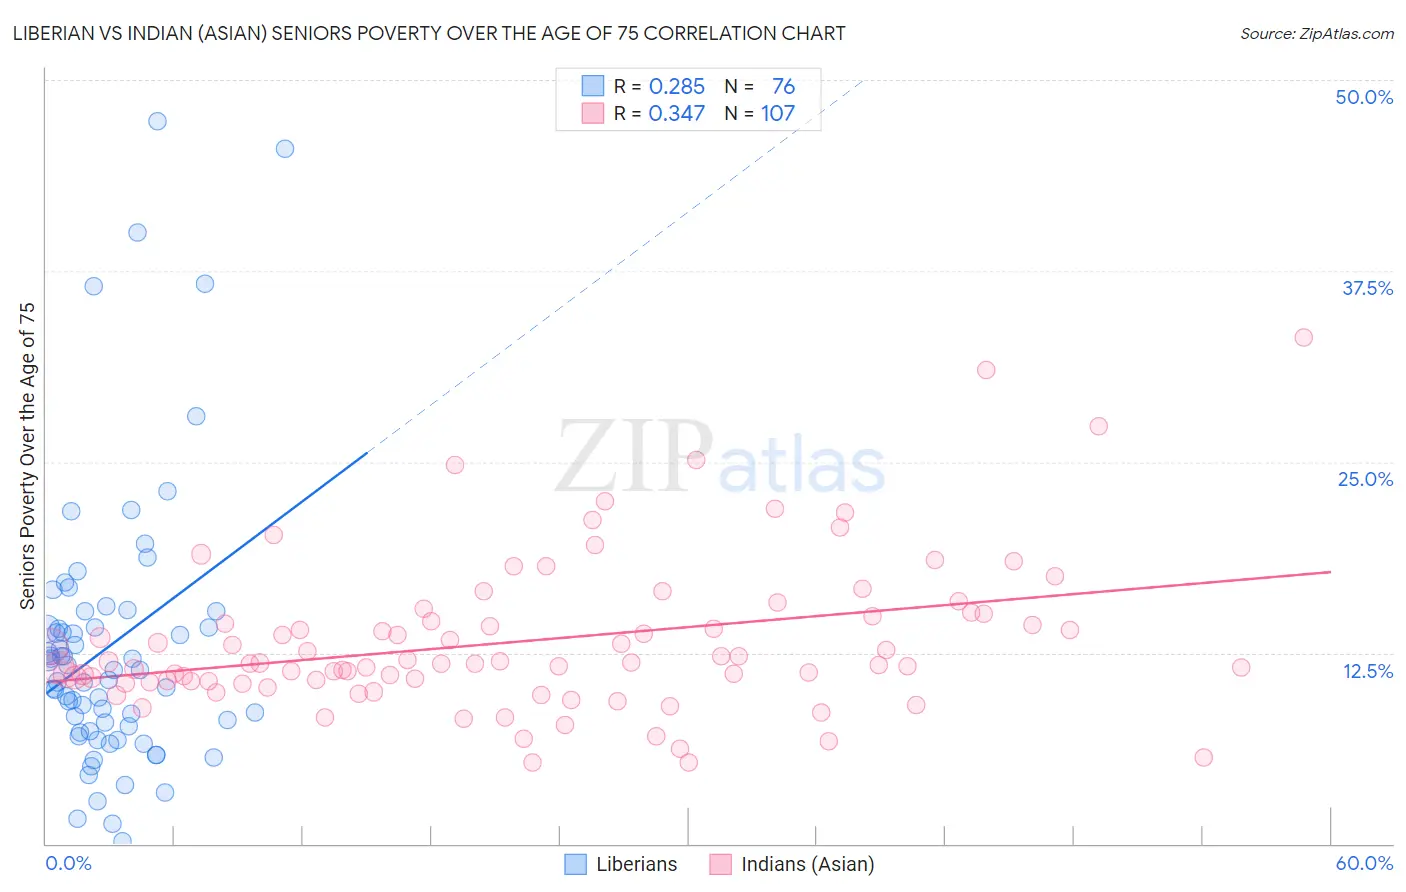
Liberian vs Indian (Asian) Seniors Poverty Over the Age of 75 Correlation Chart
The statistical analysis conducted on geographies consisting of 117,599,519 people shows a weak positive correlation between the proportion of Liberians and poverty level among seniors over the age of 75 in the United States with a correlation coefficient (R) of 0.285 and weighted average of 12.5%. Similarly, the statistical analysis conducted on geographies consisting of 486,315,330 people shows a mild positive correlation between the proportion of Indians (Asian) and poverty level among seniors over the age of 75 in the United States with a correlation coefficient (R) of 0.347 and weighted average of 12.7%, a difference of 2.0%.
Seniors Poverty Over the Age of 75 Correlation Summary
| Measurement | Liberian | Indian (Asian) |
| Minimum | 0.12% | 5.3% |
| Maximum | 47.3% | 33.1% |
| Range | 47.2% | 27.8% |
| Mean | 13.0% | 13.3% |
| Median | 11.4% | 11.8% |
| Interquartile 25% (IQ1) | 7.5% | 10.6% |
| Interquartile 75% (IQ3) | 14.7% | 14.9% |
| Interquartile Range (IQR) | 7.2% | 4.2% |
| Standard Deviation (Sample) | 9.2% | 5.0% |
| Standard Deviation (Population) | 9.1% | 5.0% |
Demographics Similar to Liberians and Indians (Asian) by Seniors Poverty Over the Age of 75
In terms of seniors poverty over the age of 75, the demographic groups most similar to Liberians are Immigrants from Congo (12.5%, a difference of 0.070%), Immigrants from Indonesia (12.5%, a difference of 0.13%), Immigrants from Northern Africa (12.5%, a difference of 0.22%), Choctaw (12.5%, a difference of 0.35%), and Taiwanese (12.6%, a difference of 0.66%). Similarly, the demographic groups most similar to Indians (Asian) are Albanian (12.7%, a difference of 0.040%), Immigrants from Eritrea (12.7%, a difference of 0.16%), Immigrants from Southern Europe (12.7%, a difference of 0.19%), Costa Rican (12.8%, a difference of 0.24%), and Arapaho (12.7%, a difference of 0.25%).
| Demographics | Rating | Rank | Seniors Poverty Over the Age of 75 |
| Immigrants | Northern Africa | 25.2 /100 | #188 | Fair 12.5% |
| Immigrants | Indonesia | 24.4 /100 | #189 | Fair 12.5% |
| Immigrants | Congo | 23.9 /100 | #190 | Fair 12.5% |
| Liberians | 23.2 /100 | #191 | Fair 12.5% |
| Choctaw | 20.2 /100 | #192 | Fair 12.5% |
| Taiwanese | 17.8 /100 | #193 | Poor 12.6% |
| Alsatians | 17.7 /100 | #194 | Poor 12.6% |
| Immigrants | France | 17.4 /100 | #195 | Poor 12.6% |
| Immigrants | Eastern Europe | 16.0 /100 | #196 | Poor 12.6% |
| Nepalese | 14.4 /100 | #197 | Poor 12.6% |
| Chileans | 13.7 /100 | #198 | Poor 12.6% |
| Immigrants | Lebanon | 12.7 /100 | #199 | Poor 12.7% |
| Immigrants | Vietnam | 12.1 /100 | #200 | Poor 12.7% |
| Paraguayans | 11.1 /100 | #201 | Poor 12.7% |
| Arapaho | 10.9 /100 | #202 | Poor 12.7% |
| Immigrants | Southern Europe | 10.7 /100 | #203 | Poor 12.7% |
| Immigrants | Eritrea | 10.5 /100 | #204 | Poor 12.7% |
| Indians (Asian) | 9.7 /100 | #205 | Tragic 12.7% |
| Albanians | 9.6 /100 | #206 | Tragic 12.7% |
| Costa Ricans | 8.7 /100 | #207 | Tragic 12.8% |
| Immigrants | Eastern Asia | 8.4 /100 | #208 | Tragic 12.8% |