Liberian vs Immigrants from Northern Africa Seniors Poverty Over the Age of 75
COMPARE
Liberian
Immigrants from Northern Africa
Seniors Poverty Over the Age of 75
Seniors Poverty Over the Age of 75 Comparison
Liberians
Immigrants from Northern Africa
12.5%
SENIORS POVERTY OVER THE AGE OF 75
23.2/ 100
METRIC RATING
191st/ 347
METRIC RANK
12.5%
SENIORS POVERTY OVER THE AGE OF 75
25.2/ 100
METRIC RATING
188th/ 347
METRIC RANK
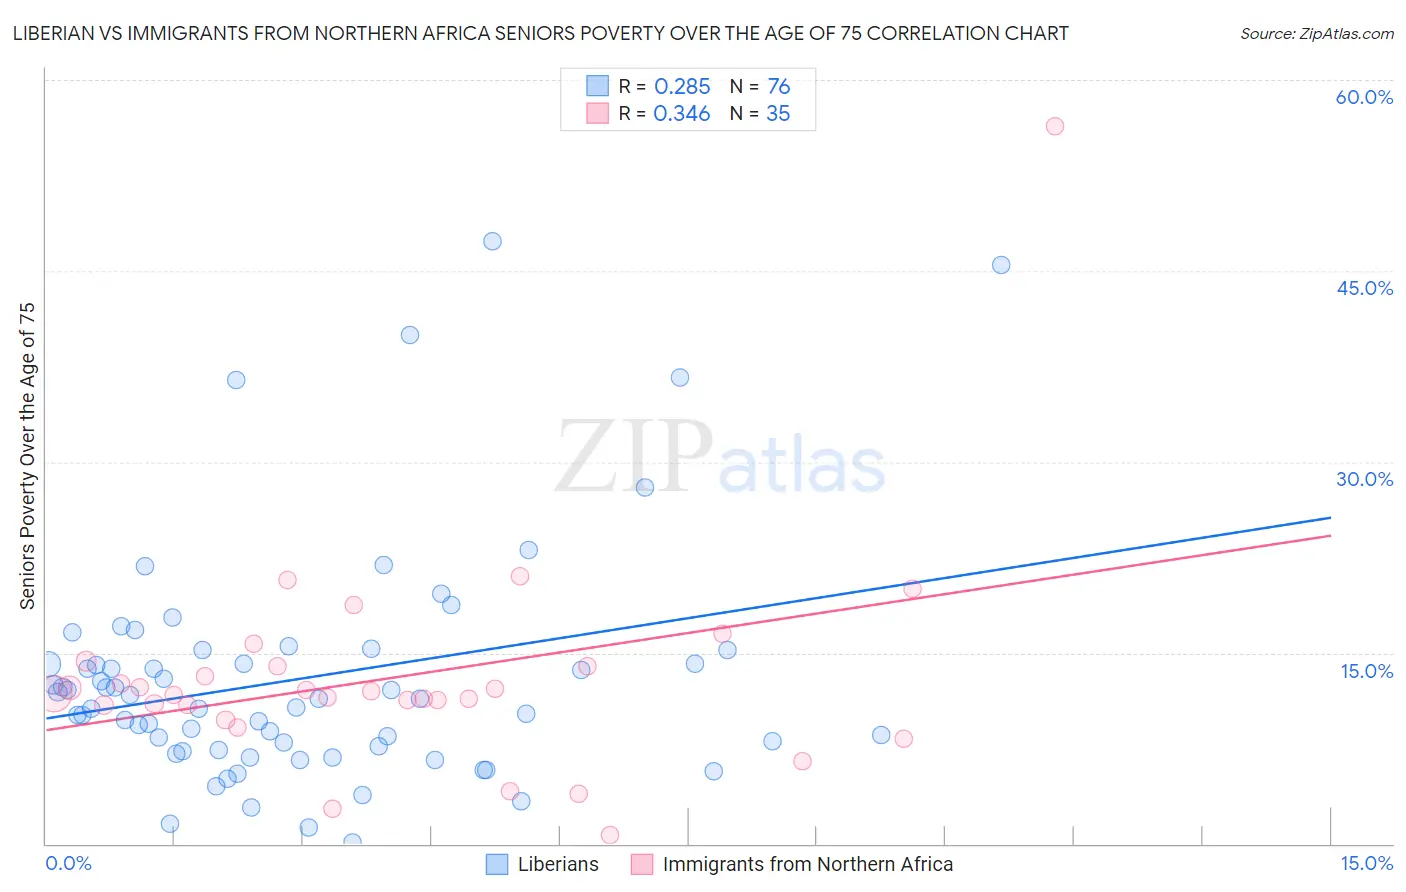
Liberian vs Immigrants from Northern Africa Seniors Poverty Over the Age of 75 Correlation Chart
The statistical analysis conducted on geographies consisting of 117,599,519 people shows a weak positive correlation between the proportion of Liberians and poverty level among seniors over the age of 75 in the United States with a correlation coefficient (R) of 0.285 and weighted average of 12.5%. Similarly, the statistical analysis conducted on geographies consisting of 318,437,817 people shows a mild positive correlation between the proportion of Immigrants from Northern Africa and poverty level among seniors over the age of 75 in the United States with a correlation coefficient (R) of 0.346 and weighted average of 12.5%, a difference of 0.22%.
Seniors Poverty Over the Age of 75 Correlation Summary
| Measurement | Liberian | Immigrants from Northern Africa |
| Minimum | 0.12% | 0.66% |
| Maximum | 47.3% | 56.4% |
| Range | 47.2% | 55.7% |
| Mean | 13.0% | 13.0% |
| Median | 11.4% | 11.8% |
| Interquartile 25% (IQ1) | 7.5% | 10.9% |
| Interquartile 75% (IQ3) | 14.7% | 14.0% |
| Interquartile Range (IQR) | 7.2% | 3.1% |
| Standard Deviation (Sample) | 9.2% | 8.8% |
| Standard Deviation (Population) | 9.1% | 8.7% |
Demographics Similar to Liberians and Immigrants from Northern Africa by Seniors Poverty Over the Age of 75
In terms of seniors poverty over the age of 75, the demographic groups most similar to Liberians are Immigrants from Congo (12.5%, a difference of 0.070%), Immigrants from Indonesia (12.5%, a difference of 0.13%), Yaqui (12.5%, a difference of 0.29%), Choctaw (12.5%, a difference of 0.35%), and Taiwanese (12.6%, a difference of 0.66%). Similarly, the demographic groups most similar to Immigrants from Northern Africa are Yaqui (12.5%, a difference of 0.070%), Immigrants from Indonesia (12.5%, a difference of 0.090%), Immigrants from Congo (12.5%, a difference of 0.15%), Choctaw (12.5%, a difference of 0.57%), and Sri Lankan (12.4%, a difference of 0.70%).
| Demographics | Rating | Rank | Seniors Poverty Over the Age of 75 |
| Mongolians | 45.5 /100 | #179 | Average 12.2% |
| Immigrants | South Eastern Asia | 44.3 /100 | #180 | Average 12.2% |
| Immigrants | Australia | 44.2 /100 | #181 | Average 12.2% |
| German Russians | 41.4 /100 | #182 | Average 12.3% |
| Laotians | 38.2 /100 | #183 | Fair 12.3% |
| Kiowa | 36.0 /100 | #184 | Fair 12.3% |
| Immigrants | Malaysia | 35.8 /100 | #185 | Fair 12.3% |
| Sri Lankans | 32.3 /100 | #186 | Fair 12.4% |
| Yaqui | 25.9 /100 | #187 | Fair 12.5% |
| Immigrants | Northern Africa | 25.2 /100 | #188 | Fair 12.5% |
| Immigrants | Indonesia | 24.4 /100 | #189 | Fair 12.5% |
| Immigrants | Congo | 23.9 /100 | #190 | Fair 12.5% |
| Liberians | 23.2 /100 | #191 | Fair 12.5% |
| Choctaw | 20.2 /100 | #192 | Fair 12.5% |
| Taiwanese | 17.8 /100 | #193 | Poor 12.6% |
| Alsatians | 17.7 /100 | #194 | Poor 12.6% |
| Immigrants | France | 17.4 /100 | #195 | Poor 12.6% |
| Immigrants | Eastern Europe | 16.0 /100 | #196 | Poor 12.6% |
| Nepalese | 14.4 /100 | #197 | Poor 12.6% |
| Chileans | 13.7 /100 | #198 | Poor 12.6% |
| Immigrants | Lebanon | 12.7 /100 | #199 | Poor 12.7% |