Laotian vs Immigrants from Dominican Republic Seniors Poverty Over the Age of 75
COMPARE
Laotian
Immigrants from Dominican Republic
Seniors Poverty Over the Age of 75
Seniors Poverty Over the Age of 75 Comparison
Laotians
Immigrants from Dominican Republic
12.3%
SENIORS POVERTY OVER THE AGE OF 75
38.2/ 100
METRIC RATING
183rd/ 347
METRIC RANK
20.1%
SENIORS POVERTY OVER THE AGE OF 75
0.0/ 100
METRIC RATING
345th/ 347
METRIC RANK
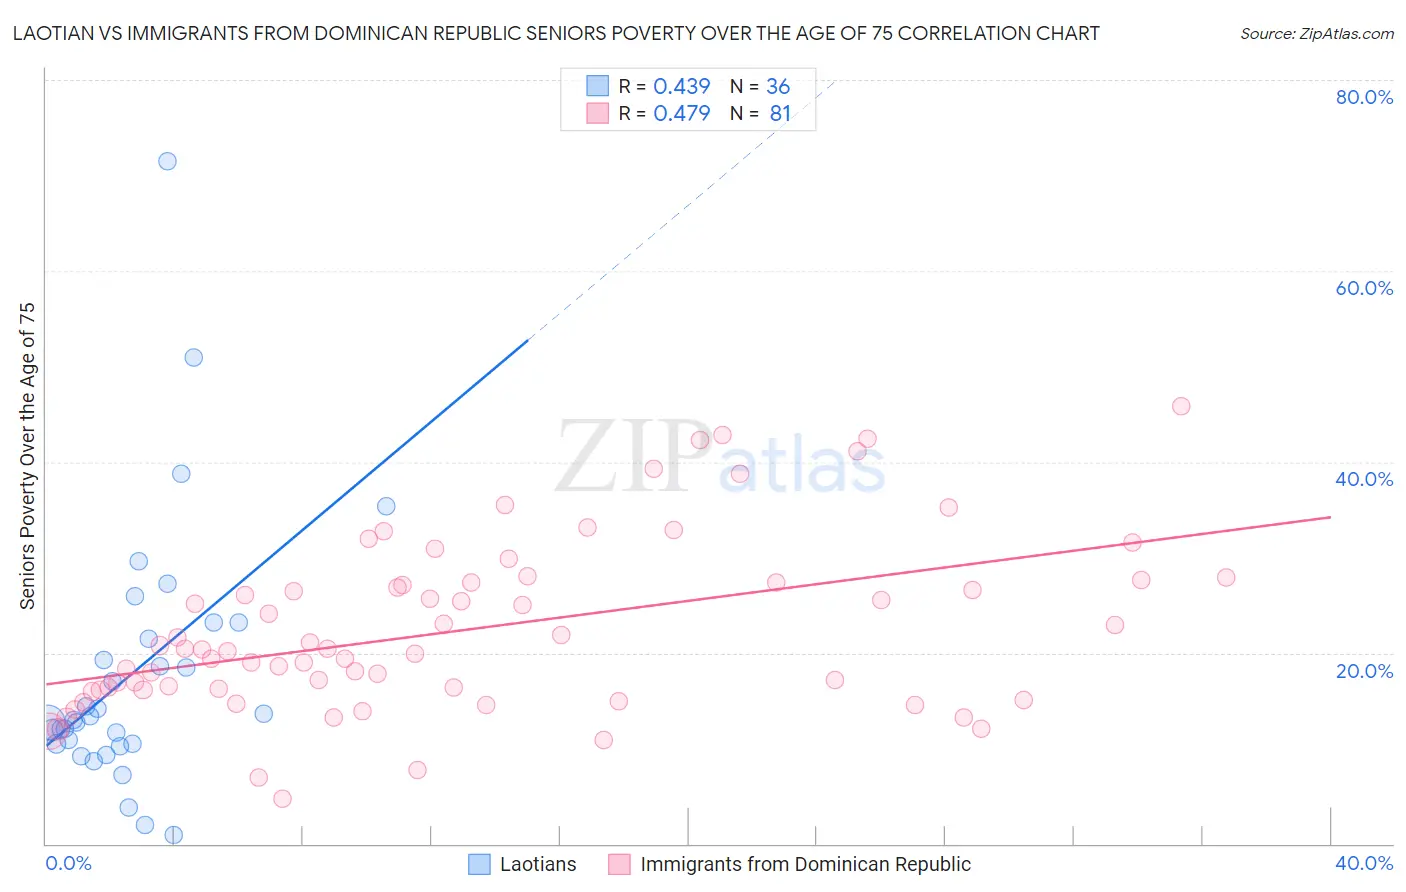
Laotian vs Immigrants from Dominican Republic Seniors Poverty Over the Age of 75 Correlation Chart
The statistical analysis conducted on geographies consisting of 223,378,771 people shows a moderate positive correlation between the proportion of Laotians and poverty level among seniors over the age of 75 in the United States with a correlation coefficient (R) of 0.439 and weighted average of 12.3%. Similarly, the statistical analysis conducted on geographies consisting of 272,640,242 people shows a moderate positive correlation between the proportion of Immigrants from Dominican Republic and poverty level among seniors over the age of 75 in the United States with a correlation coefficient (R) of 0.479 and weighted average of 20.1%, a difference of 62.9%.
Seniors Poverty Over the Age of 75 Correlation Summary
| Measurement | Laotian | Immigrants from Dominican Republic |
| Minimum | 0.93% | 4.8% |
| Maximum | 71.4% | 45.8% |
| Range | 70.5% | 41.1% |
| Mean | 17.9% | 22.4% |
| Median | 13.2% | 20.3% |
| Interquartile 25% (IQ1) | 10.4% | 16.1% |
| Interquartile 75% (IQ3) | 22.3% | 27.3% |
| Interquartile Range (IQR) | 11.9% | 11.2% |
| Standard Deviation (Sample) | 13.8% | 9.0% |
| Standard Deviation (Population) | 13.6% | 8.9% |
Similar Demographics by Seniors Poverty Over the Age of 75
Demographics Similar to Laotians by Seniors Poverty Over the Age of 75
In terms of seniors poverty over the age of 75, the demographic groups most similar to Laotians are Kiowa (12.3%, a difference of 0.19%), Immigrants from Malaysia (12.3%, a difference of 0.20%), German Russian (12.3%, a difference of 0.27%), Immigrants from Australia (12.2%, a difference of 0.50%), and Immigrants from South Eastern Asia (12.2%, a difference of 0.51%).
| Demographics | Rating | Rank | Seniors Poverty Over the Age of 75 |
| Immigrants | Iran | 48.1 /100 | #176 | Average 12.2% |
| Immigrants | Asia | 47.8 /100 | #177 | Average 12.2% |
| Immigrants | Nonimmigrants | 46.8 /100 | #178 | Average 12.2% |
| Mongolians | 45.5 /100 | #179 | Average 12.2% |
| Immigrants | South Eastern Asia | 44.3 /100 | #180 | Average 12.2% |
| Immigrants | Australia | 44.2 /100 | #181 | Average 12.2% |
| German Russians | 41.4 /100 | #182 | Average 12.3% |
| Laotians | 38.2 /100 | #183 | Fair 12.3% |
| Kiowa | 36.0 /100 | #184 | Fair 12.3% |
| Immigrants | Malaysia | 35.8 /100 | #185 | Fair 12.3% |
| Sri Lankans | 32.3 /100 | #186 | Fair 12.4% |
| Yaqui | 25.9 /100 | #187 | Fair 12.5% |
| Immigrants | Northern Africa | 25.2 /100 | #188 | Fair 12.5% |
| Immigrants | Indonesia | 24.4 /100 | #189 | Fair 12.5% |
| Immigrants | Congo | 23.9 /100 | #190 | Fair 12.5% |
Demographics Similar to Immigrants from Dominican Republic by Seniors Poverty Over the Age of 75
In terms of seniors poverty over the age of 75, the demographic groups most similar to Immigrants from Dominican Republic are Immigrants from Cuba (19.9%, a difference of 0.78%), Lumbee (19.7%, a difference of 1.6%), Dominican (19.6%, a difference of 2.2%), Navajo (19.4%, a difference of 3.5%), and Tohono O'odham (19.1%, a difference of 4.8%).
| Demographics | Rating | Rank | Seniors Poverty Over the Age of 75 |
| Immigrants | Nicaragua | 0.0 /100 | #333 | Tragic 17.6% |
| Immigrants | Grenada | 0.0 /100 | #334 | Tragic 17.8% |
| Cubans | 0.0 /100 | #335 | Tragic 18.0% |
| Immigrants | Caribbean | 0.0 /100 | #336 | Tragic 18.2% |
| Yakama | 0.0 /100 | #337 | Tragic 18.3% |
| Immigrants | Cabo Verde | 0.0 /100 | #338 | Tragic 18.5% |
| Hopi | 0.0 /100 | #339 | Tragic 18.9% |
| Tohono O'odham | 0.0 /100 | #340 | Tragic 19.1% |
| Navajo | 0.0 /100 | #341 | Tragic 19.4% |
| Dominicans | 0.0 /100 | #342 | Tragic 19.6% |
| Lumbee | 0.0 /100 | #343 | Tragic 19.7% |
| Immigrants | Cuba | 0.0 /100 | #344 | Tragic 19.9% |
| Immigrants | Dominican Republic | 0.0 /100 | #345 | Tragic 20.1% |
| Puerto Ricans | 0.0 /100 | #346 | Tragic 23.2% |
| Pima | 0.0 /100 | #347 | Tragic 23.9% |