Central American vs Immigrants from Dominican Republic Seniors Poverty Over the Age of 75
COMPARE
Central American
Immigrants from Dominican Republic
Seniors Poverty Over the Age of 75
Seniors Poverty Over the Age of 75 Comparison
Central Americans
Immigrants from Dominican Republic
14.7%
SENIORS POVERTY OVER THE AGE OF 75
0.0/ 100
METRIC RATING
280th/ 347
METRIC RANK
20.1%
SENIORS POVERTY OVER THE AGE OF 75
0.0/ 100
METRIC RATING
345th/ 347
METRIC RANK
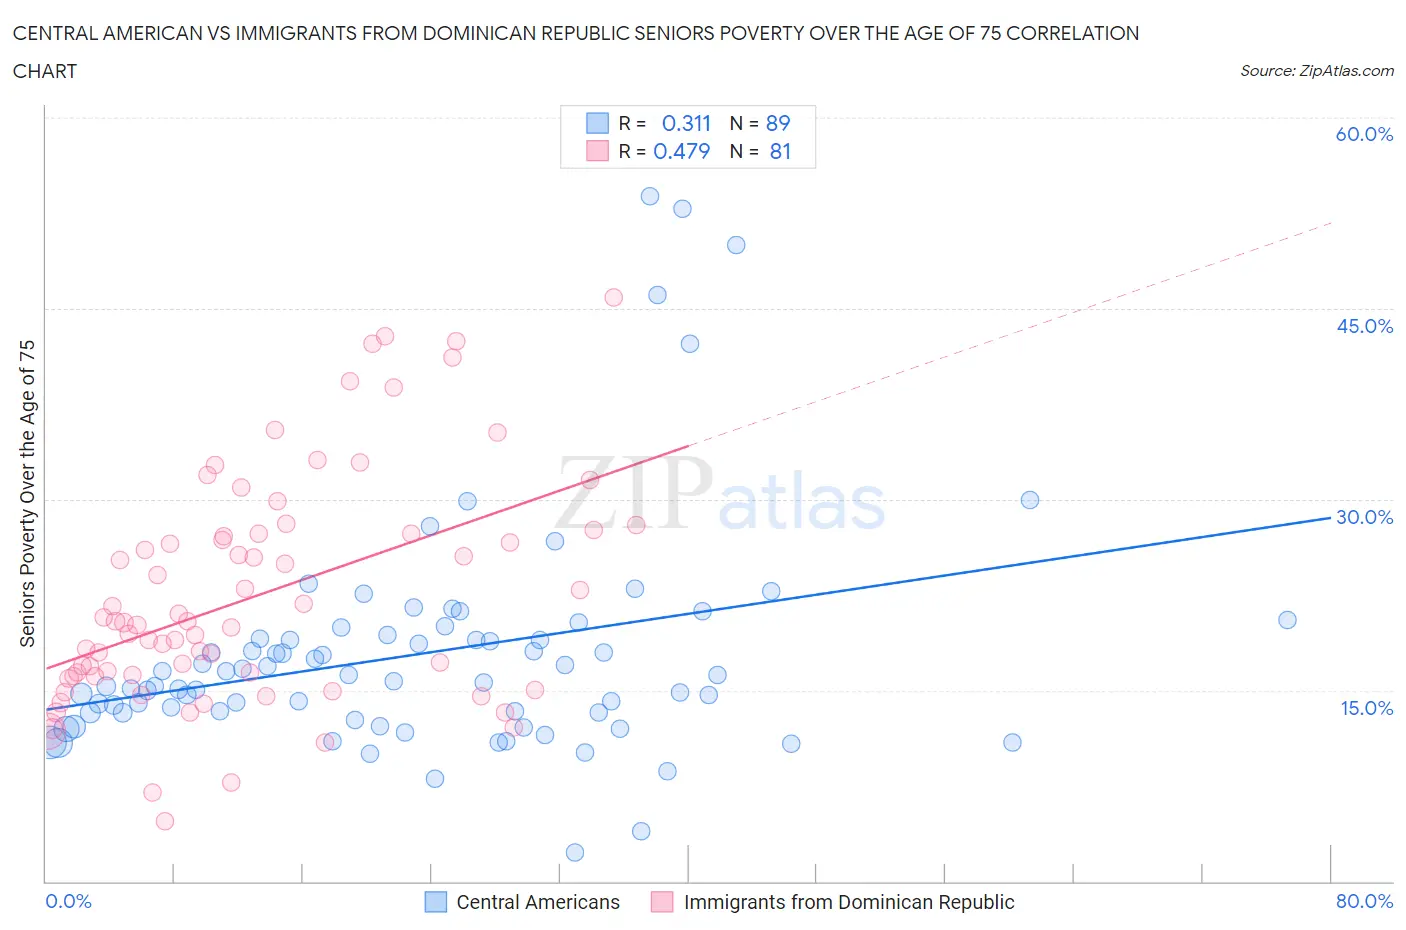
Central American vs Immigrants from Dominican Republic Seniors Poverty Over the Age of 75 Correlation Chart
The statistical analysis conducted on geographies consisting of 495,711,598 people shows a mild positive correlation between the proportion of Central Americans and poverty level among seniors over the age of 75 in the United States with a correlation coefficient (R) of 0.311 and weighted average of 14.7%. Similarly, the statistical analysis conducted on geographies consisting of 272,640,242 people shows a moderate positive correlation between the proportion of Immigrants from Dominican Republic and poverty level among seniors over the age of 75 in the United States with a correlation coefficient (R) of 0.479 and weighted average of 20.1%, a difference of 36.1%.
Seniors Poverty Over the Age of 75 Correlation Summary
| Measurement | Central American | Immigrants from Dominican Republic |
| Minimum | 2.3% | 4.8% |
| Maximum | 53.8% | 45.8% |
| Range | 51.5% | 41.1% |
| Mean | 17.8% | 22.4% |
| Median | 15.7% | 20.3% |
| Interquartile 25% (IQ1) | 13.2% | 16.1% |
| Interquartile 75% (IQ3) | 19.2% | 27.3% |
| Interquartile Range (IQR) | 6.0% | 11.2% |
| Standard Deviation (Sample) | 9.1% | 9.0% |
| Standard Deviation (Population) | 9.0% | 8.9% |
Similar Demographics by Seniors Poverty Over the Age of 75
Demographics Similar to Central Americans by Seniors Poverty Over the Age of 75
In terms of seniors poverty over the age of 75, the demographic groups most similar to Central Americans are Belizean (14.8%, a difference of 0.12%), Immigrants from Senegal (14.8%, a difference of 0.29%), Guatemalan (14.8%, a difference of 0.35%), Black/African American (14.6%, a difference of 0.64%), and Immigrants from Colombia (14.6%, a difference of 0.85%).
| Demographics | Rating | Rank | Seniors Poverty Over the Age of 75 |
| Immigrants | South America | 0.0 /100 | #273 | Tragic 14.4% |
| Immigrants | Bahamas | 0.0 /100 | #274 | Tragic 14.4% |
| Immigrants | El Salvador | 0.0 /100 | #275 | Tragic 14.5% |
| Soviet Union | 0.0 /100 | #276 | Tragic 14.5% |
| Senegalese | 0.0 /100 | #277 | Tragic 14.5% |
| Immigrants | Colombia | 0.0 /100 | #278 | Tragic 14.6% |
| Blacks/African Americans | 0.0 /100 | #279 | Tragic 14.6% |
| Central Americans | 0.0 /100 | #280 | Tragic 14.7% |
| Belizeans | 0.0 /100 | #281 | Tragic 14.8% |
| Immigrants | Senegal | 0.0 /100 | #282 | Tragic 14.8% |
| Guatemalans | 0.0 /100 | #283 | Tragic 14.8% |
| Cheyenne | 0.0 /100 | #284 | Tragic 14.9% |
| Immigrants | Mexico | 0.0 /100 | #285 | Tragic 14.9% |
| Immigrants | Central America | 0.0 /100 | #286 | Tragic 15.0% |
| Immigrants | Guatemala | 0.0 /100 | #287 | Tragic 15.1% |
Demographics Similar to Immigrants from Dominican Republic by Seniors Poverty Over the Age of 75
In terms of seniors poverty over the age of 75, the demographic groups most similar to Immigrants from Dominican Republic are Immigrants from Cuba (19.9%, a difference of 0.78%), Lumbee (19.7%, a difference of 1.6%), Dominican (19.6%, a difference of 2.2%), Navajo (19.4%, a difference of 3.5%), and Tohono O'odham (19.1%, a difference of 4.8%).
| Demographics | Rating | Rank | Seniors Poverty Over the Age of 75 |
| Immigrants | Nicaragua | 0.0 /100 | #333 | Tragic 17.6% |
| Immigrants | Grenada | 0.0 /100 | #334 | Tragic 17.8% |
| Cubans | 0.0 /100 | #335 | Tragic 18.0% |
| Immigrants | Caribbean | 0.0 /100 | #336 | Tragic 18.2% |
| Yakama | 0.0 /100 | #337 | Tragic 18.3% |
| Immigrants | Cabo Verde | 0.0 /100 | #338 | Tragic 18.5% |
| Hopi | 0.0 /100 | #339 | Tragic 18.9% |
| Tohono O'odham | 0.0 /100 | #340 | Tragic 19.1% |
| Navajo | 0.0 /100 | #341 | Tragic 19.4% |
| Dominicans | 0.0 /100 | #342 | Tragic 19.6% |
| Lumbee | 0.0 /100 | #343 | Tragic 19.7% |
| Immigrants | Cuba | 0.0 /100 | #344 | Tragic 19.9% |
| Immigrants | Dominican Republic | 0.0 /100 | #345 | Tragic 20.1% |
| Puerto Ricans | 0.0 /100 | #346 | Tragic 23.2% |
| Pima | 0.0 /100 | #347 | Tragic 23.9% |