Kiowa vs Potawatomi Seniors Poverty Over the Age of 75
COMPARE
Kiowa
Potawatomi
Seniors Poverty Over the Age of 75
Seniors Poverty Over the Age of 75 Comparison
Kiowa
Potawatomi
12.3%
SENIORS POVERTY OVER THE AGE OF 75
36.0/ 100
METRIC RATING
184th/ 347
METRIC RANK
12.1%
SENIORS POVERTY OVER THE AGE OF 75
57.4/ 100
METRIC RATING
164th/ 347
METRIC RANK
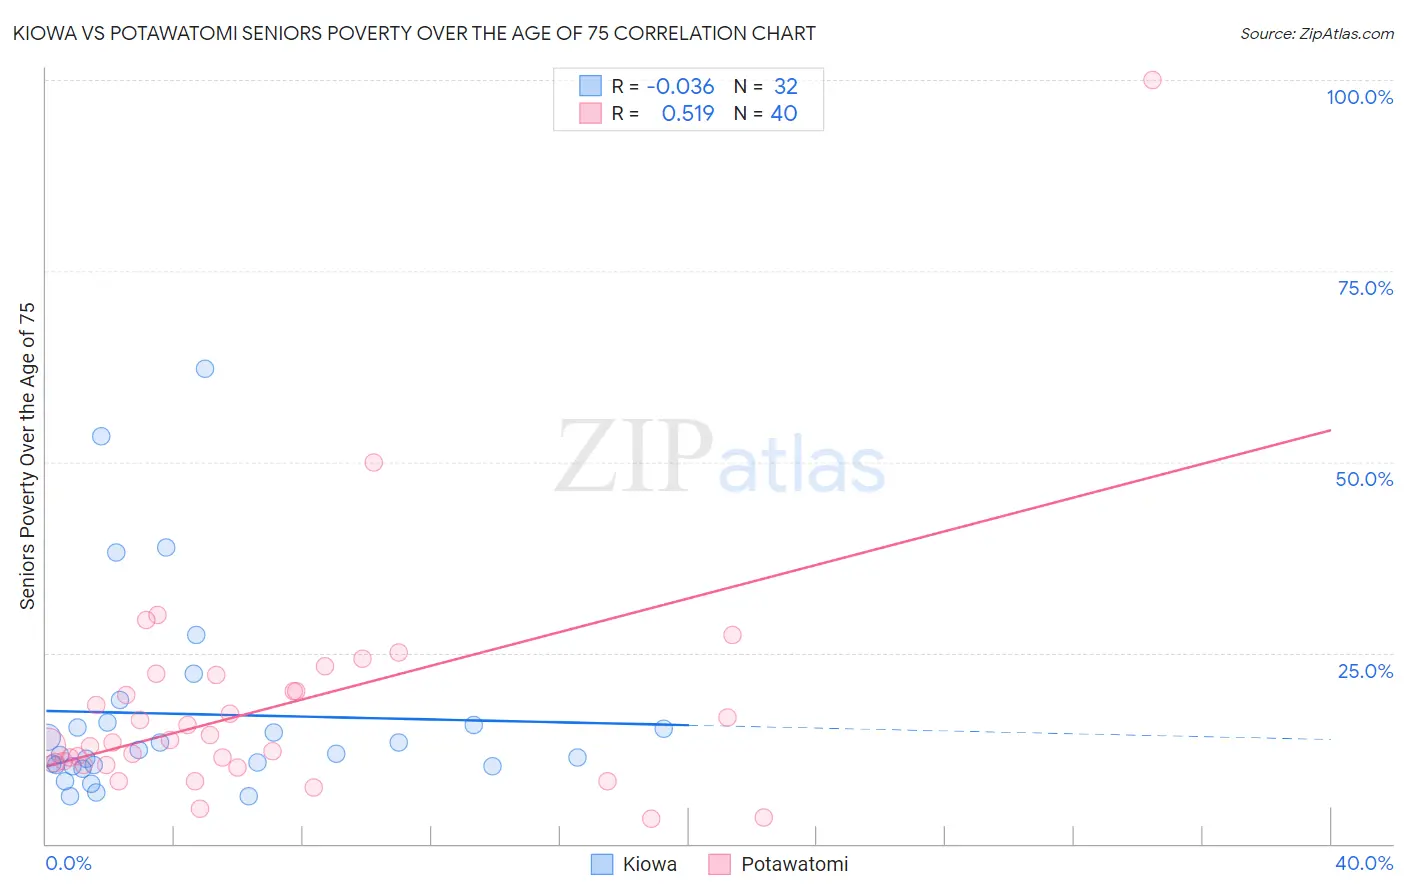
Kiowa vs Potawatomi Seniors Poverty Over the Age of 75 Correlation Chart
The statistical analysis conducted on geographies consisting of 55,954,545 people shows no correlation between the proportion of Kiowa and poverty level among seniors over the age of 75 in the United States with a correlation coefficient (R) of -0.036 and weighted average of 12.3%. Similarly, the statistical analysis conducted on geographies consisting of 117,390,328 people shows a substantial positive correlation between the proportion of Potawatomi and poverty level among seniors over the age of 75 in the United States with a correlation coefficient (R) of 0.519 and weighted average of 12.1%, a difference of 1.8%.
Seniors Poverty Over the Age of 75 Correlation Summary
| Measurement | Kiowa | Potawatomi |
| Minimum | 6.1% | 3.3% |
| Maximum | 62.3% | 100.0% |
| Range | 56.1% | 96.7% |
| Mean | 17.0% | 17.9% |
| Median | 12.1% | 13.4% |
| Interquartile 25% (IQ1) | 10.2% | 10.5% |
| Interquartile 75% (IQ3) | 15.7% | 21.1% |
| Interquartile Range (IQR) | 5.5% | 10.6% |
| Standard Deviation (Sample) | 13.2% | 15.9% |
| Standard Deviation (Population) | 13.0% | 15.7% |
Demographics Similar to Kiowa and Potawatomi by Seniors Poverty Over the Age of 75
In terms of seniors poverty over the age of 75, the demographic groups most similar to Kiowa are Laotian (12.3%, a difference of 0.19%), German Russian (12.3%, a difference of 0.46%), Immigrants from Australia (12.2%, a difference of 0.69%), Immigrants from South Eastern Asia (12.2%, a difference of 0.70%), and Mongolian (12.2%, a difference of 0.81%). Similarly, the demographic groups most similar to Potawatomi are Okinawan (12.1%, a difference of 0.090%), Egyptian (12.1%, a difference of 0.21%), Immigrants from Switzerland (12.1%, a difference of 0.23%), Immigrants from Syria (12.2%, a difference of 0.29%), and Immigrants from Egypt (12.2%, a difference of 0.30%).
| Demographics | Rating | Rank | Seniors Poverty Over the Age of 75 |
| Potawatomi | 57.4 /100 | #164 | Average 12.1% |
| Okinawans | 56.3 /100 | #165 | Average 12.1% |
| Egyptians | 54.8 /100 | #166 | Average 12.1% |
| Immigrants | Switzerland | 54.5 /100 | #167 | Average 12.1% |
| Immigrants | Syria | 53.9 /100 | #168 | Average 12.2% |
| Immigrants | Egypt | 53.7 /100 | #169 | Average 12.2% |
| Immigrants | Thailand | 52.0 /100 | #170 | Average 12.2% |
| Spaniards | 51.6 /100 | #171 | Average 12.2% |
| Immigrants | Fiji | 51.5 /100 | #172 | Average 12.2% |
| Arabs | 50.5 /100 | #173 | Average 12.2% |
| Immigrants | Europe | 50.0 /100 | #174 | Average 12.2% |
| Immigrants | Saudi Arabia | 49.5 /100 | #175 | Average 12.2% |
| Immigrants | Iran | 48.1 /100 | #176 | Average 12.2% |
| Immigrants | Asia | 47.8 /100 | #177 | Average 12.2% |
| Immigrants | Nonimmigrants | 46.8 /100 | #178 | Average 12.2% |
| Mongolians | 45.5 /100 | #179 | Average 12.2% |
| Immigrants | South Eastern Asia | 44.3 /100 | #180 | Average 12.2% |
| Immigrants | Australia | 44.2 /100 | #181 | Average 12.2% |
| German Russians | 41.4 /100 | #182 | Average 12.3% |
| Laotians | 38.2 /100 | #183 | Fair 12.3% |
| Kiowa | 36.0 /100 | #184 | Fair 12.3% |