Kiowa vs Austrian Seniors Poverty Over the Age of 75
COMPARE
Kiowa
Austrian
Seniors Poverty Over the Age of 75
Seniors Poverty Over the Age of 75 Comparison
Kiowa
Austrians
12.3%
SENIORS POVERTY OVER THE AGE OF 75
36.0/ 100
METRIC RATING
184th/ 347
METRIC RANK
11.0%
SENIORS POVERTY OVER THE AGE OF 75
99.1/ 100
METRIC RATING
42nd/ 347
METRIC RANK
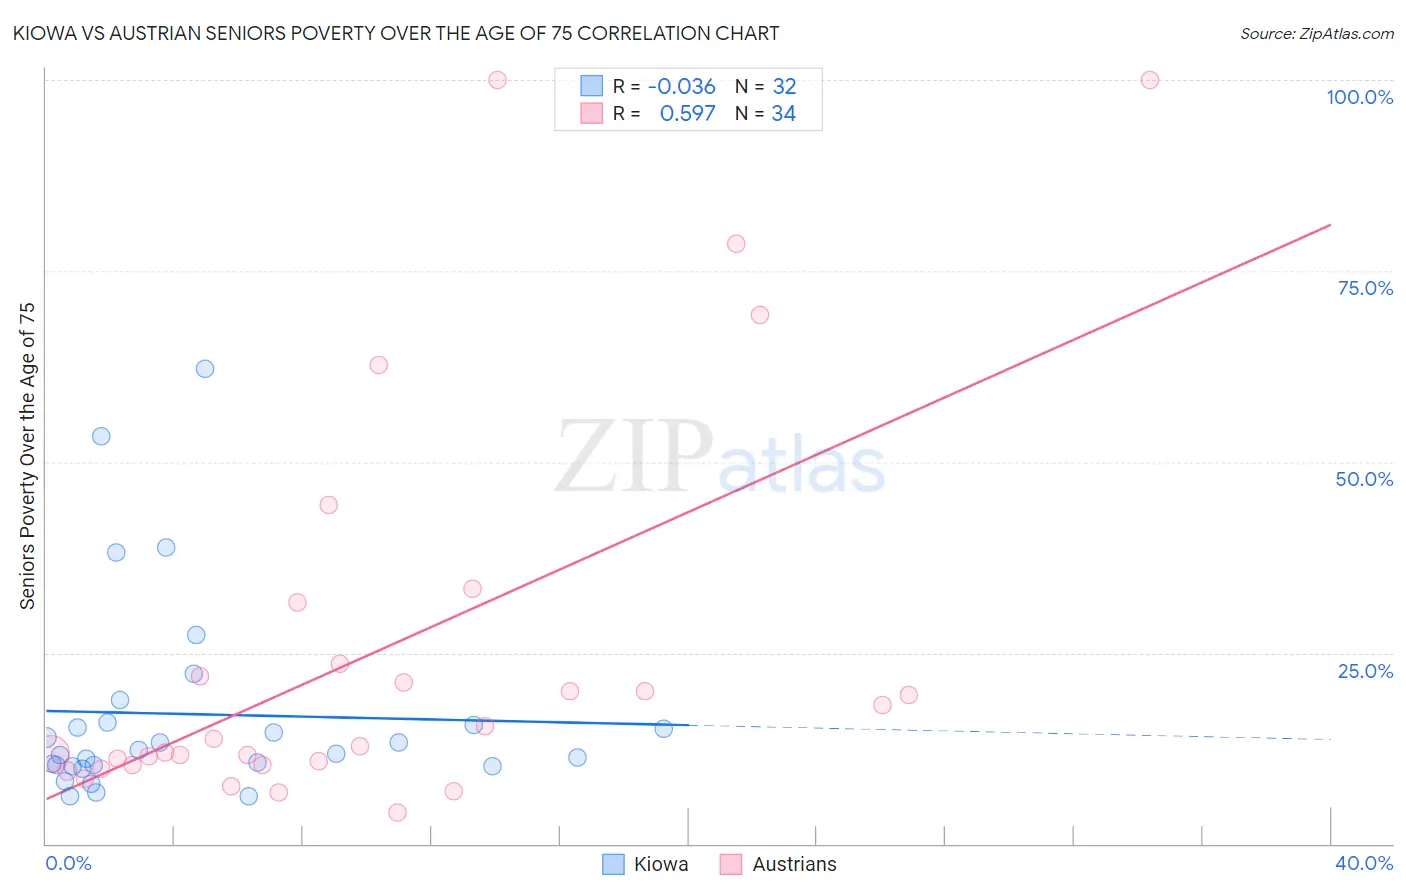
Kiowa vs Austrian Seniors Poverty Over the Age of 75 Correlation Chart
The statistical analysis conducted on geographies consisting of 55,954,545 people shows no correlation between the proportion of Kiowa and poverty level among seniors over the age of 75 in the United States with a correlation coefficient (R) of -0.036 and weighted average of 12.3%. Similarly, the statistical analysis conducted on geographies consisting of 444,924,012 people shows a substantial positive correlation between the proportion of Austrians and poverty level among seniors over the age of 75 in the United States with a correlation coefficient (R) of 0.597 and weighted average of 11.0%, a difference of 12.0%.
Seniors Poverty Over the Age of 75 Correlation Summary
| Measurement | Kiowa | Austrian |
| Minimum | 6.1% | 4.1% |
| Maximum | 62.3% | 100.0% |
| Range | 56.1% | 95.9% |
| Mean | 17.0% | 25.3% |
| Median | 12.1% | 13.3% |
| Interquartile 25% (IQ1) | 10.2% | 10.3% |
| Interquartile 75% (IQ3) | 15.7% | 23.5% |
| Interquartile Range (IQR) | 5.5% | 13.2% |
| Standard Deviation (Sample) | 13.2% | 26.0% |
| Standard Deviation (Population) | 13.0% | 25.7% |
Similar Demographics by Seniors Poverty Over the Age of 75
Demographics Similar to Kiowa by Seniors Poverty Over the Age of 75
In terms of seniors poverty over the age of 75, the demographic groups most similar to Kiowa are Immigrants from Malaysia (12.3%, a difference of 0.010%), Laotian (12.3%, a difference of 0.19%), Sri Lankan (12.4%, a difference of 0.32%), German Russian (12.3%, a difference of 0.46%), and Immigrants from Australia (12.2%, a difference of 0.69%).
| Demographics | Rating | Rank | Seniors Poverty Over the Age of 75 |
| Immigrants | Asia | 47.8 /100 | #177 | Average 12.2% |
| Immigrants | Nonimmigrants | 46.8 /100 | #178 | Average 12.2% |
| Mongolians | 45.5 /100 | #179 | Average 12.2% |
| Immigrants | South Eastern Asia | 44.3 /100 | #180 | Average 12.2% |
| Immigrants | Australia | 44.2 /100 | #181 | Average 12.2% |
| German Russians | 41.4 /100 | #182 | Average 12.3% |
| Laotians | 38.2 /100 | #183 | Fair 12.3% |
| Kiowa | 36.0 /100 | #184 | Fair 12.3% |
| Immigrants | Malaysia | 35.8 /100 | #185 | Fair 12.3% |
| Sri Lankans | 32.3 /100 | #186 | Fair 12.4% |
| Yaqui | 25.9 /100 | #187 | Fair 12.5% |
| Immigrants | Northern Africa | 25.2 /100 | #188 | Fair 12.5% |
| Immigrants | Indonesia | 24.4 /100 | #189 | Fair 12.5% |
| Immigrants | Congo | 23.9 /100 | #190 | Fair 12.5% |
| Liberians | 23.2 /100 | #191 | Fair 12.5% |
Demographics Similar to Austrians by Seniors Poverty Over the Age of 75
In terms of seniors poverty over the age of 75, the demographic groups most similar to Austrians are Celtic (11.0%, a difference of 0.050%), Belgian (11.0%, a difference of 0.080%), Immigrants from Lithuania (11.0%, a difference of 0.27%), Carpatho Rusyn (11.1%, a difference of 0.35%), and Greek (11.1%, a difference of 0.42%).
| Demographics | Rating | Rank | Seniors Poverty Over the Age of 75 |
| Luxembourgers | 99.6 /100 | #35 | Exceptional 10.8% |
| Scotch-Irish | 99.6 /100 | #36 | Exceptional 10.8% |
| Latvians | 99.6 /100 | #37 | Exceptional 10.8% |
| Finns | 99.6 /100 | #38 | Exceptional 10.8% |
| Czechoslovakians | 99.4 /100 | #39 | Exceptional 10.9% |
| Thais | 99.4 /100 | #40 | Exceptional 10.9% |
| Immigrants | Lithuania | 99.2 /100 | #41 | Exceptional 11.0% |
| Austrians | 99.1 /100 | #42 | Exceptional 11.0% |
| Celtics | 99.1 /100 | #43 | Exceptional 11.0% |
| Belgians | 99.1 /100 | #44 | Exceptional 11.0% |
| Carpatho Rusyns | 99.0 /100 | #45 | Exceptional 11.1% |
| Greeks | 99.0 /100 | #46 | Exceptional 11.1% |
| Hawaiians | 98.8 /100 | #47 | Exceptional 11.1% |
| French | 98.7 /100 | #48 | Exceptional 11.1% |
| Samoans | 98.7 /100 | #49 | Exceptional 11.1% |