Kiowa vs Iranian Child Poverty Among Boys Under 16

COMPARE

Kiowa
Race
Ancestry
AfghanAfricanAlaska NativeAlaskan AthabascanAlbanianAleutAlsatianAmericanApacheArabArapahoArgentineanArmenianAssyrian/Chaldean/SyriacAustralianAustrianBahamianBangladeshiBarbadianBasqueBelgianBelizeanBermudanBhutaneseBlackfeetBolivianBrazilianBritishBritish West IndianBulgarianBurmeseCajunCambodianCanadianCape VerdeanCarpatho RusynCelticCentral AmericanCentral American IndianCherokeeCheyenneChickasawChileanChineseChippewaChoctawColombianColvilleComancheCosta RicanCreeCreekCroatianCrowCubanCypriotCzechCzechoslovakianDanishDelawareDominicanDutchDutch West IndianEastern EuropeanEcuadorianEgyptianEnglishEstonianEthiopianEuropeanFijianFilipinoFinnishFrenchFrench American IndianFrench CanadianGermanGerman RussianGhanaianGreekGuamanian/ChamorroGuatemalanGuyaneseHaitianHmongHonduranHopiHoumaHungarianIcelanderIndian (Asian)IndonesianInupiatIraqiIrishIroquoisIsraeliItalianJamaicanJapaneseJordanianKenyanKiowaKoreanLaotianLatvianLebaneseLiberianLithuanianLumbeeLuxembourgerMacedonianMalaysianMalteseMarshalleseMenomineeMexicanMexican American IndianMongolianMoroccanNative HawaiianNavajoNepaleseNew ZealanderNicaraguanNigerianNorthern EuropeanNorwegianOkinawanOsageOttawaPaiutePakistaniPalestinianPanamanianParaguayanPennsylvania GermanPeruvianPimaPolishPortuguesePotawatomiPuebloPuerto RicanPuget Sound SalishRomanianRussianSalvadoranSamoanScandinavianScotch-IrishScottishSeminoleSenegaleseSerbianShoshoneSierra LeoneanSiouxSlavicSlovakSloveneSomaliSouth AfricanSouth AmericanSouth American IndianSoviet UnionSpaniardSpanishSpanish AmericanSpanish American IndianSri LankanSubsaharan AfricanSudaneseSwedishSwissSyrianTaiwaneseThaiTlingit-HaidaTohono O'OdhamTonganTrinidadian and TobagonianTsimshianTurkishU.S. Virgin IslanderUgandanUkrainianUruguayanUteVenezuelanVietnameseWelshWest IndianYakamaYaquiYugoslavianYumanYup'ikZimbabwean
Immigration
NonimmigrantsImmigrantsAfghanistanAfricaAlbaniaArgentinaArmeniaAsiaAustraliaAustriaBahamasBangladeshBarbadosBelarusBelgiumBelizeBoliviaBosnia and HerzegovinaBrazilBulgariaBurma/MyanmarCabo VerdeCambodiaCameroonCanadaCaribbeanCentral AmericaChileChinaColombiaCongoCosta RicaCroatiaCubaCzechoslovakiaDenmarkDominicaDominican RepublicEastern AfricaEastern AsiaEastern EuropeEcuadorEgyptEl SalvadorEnglandEritreaEthiopiaEuropeFijiFranceGermanyGhanaGreeceGrenadaGuatemalaGuyanaHaitiHondurasHong KongHungaryIndiaIndonesiaIranIraqIrelandIsraelItalyJamaicaJapanJordanKazakhstanKenyaKoreaKuwaitLaosLatin AmericaLatviaLebanonLiberiaLithuaniaMalaysiaMexicoMicronesiaMiddle AfricaMoldovaMoroccoNepalNetherlandsNicaraguaNigeriaNorth AmericaNorth MacedoniaNorthern AfricaNorthern EuropeNorwayOceaniaPakistanPanamaPeruPhilippinesPolandPortugalRomaniaRussiaSaudi ArabiaScotlandSenegalSerbiaSierra LeoneSingaporeSomaliaSouth AfricaSouth AmericaSouth Central AsiaSouth Eastern AsiaSouthern EuropeSpainSri LankaSt. Vincent and the GrenadinesSudanSwedenSwitzerlandSyriaTaiwanThailandTrinidad and TobagoTurkeyUgandaUkraineUruguayUzbekistanVenezuelaVietnamWest IndiesWestern AfricaWestern AsiaWestern EuropeYemenZaireZimbabweAzores
Iranian
Race
Ancestry
AfghanAfricanAlaska NativeAlaskan AthabascanAlbanianAleutAlsatianAmericanApacheArabArapahoArgentineanArmenianAssyrian/Chaldean/SyriacAustralianAustrianBahamianBangladeshiBarbadianBasqueBelgianBelizeanBermudanBhutaneseBlackfeetBolivianBrazilianBritishBritish West IndianBulgarianBurmeseCajunCambodianCanadianCape VerdeanCarpatho RusynCelticCentral AmericanCentral American IndianCherokeeCheyenneChickasawChileanChineseChippewaChoctawColombianColvilleComancheCosta RicanCreeCreekCroatianCrowCubanCypriotCzechCzechoslovakianDanishDelawareDominicanDutchDutch West IndianEastern EuropeanEcuadorianEgyptianEnglishEstonianEthiopianEuropeanFijianFilipinoFinnishFrenchFrench American IndianFrench CanadianGermanGerman RussianGhanaianGreekGuamanian/ChamorroGuatemalanGuyaneseHaitianHmongHonduranHopiHoumaHungarianIcelanderIndian (Asian)IndonesianInupiatIranianIraqiIrishIroquoisIsraeliItalianJamaicanJapaneseJordanianKenyanKoreanLaotianLatvianLebaneseLiberianLithuanianLumbeeLuxembourgerMacedonianMalaysianMalteseMarshalleseMenomineeMexicanMexican American IndianMongolianMoroccanNative HawaiianNavajoNepaleseNew ZealanderNicaraguanNigerianNorthern EuropeanNorwegianOkinawanOsageOttawaPaiutePakistaniPalestinianPanamanianParaguayanPennsylvania GermanPeruvianPimaPolishPortuguesePotawatomiPuebloPuerto RicanPuget Sound SalishRomanianRussianSalvadoranSamoanScandinavianScotch-IrishScottishSeminoleSenegaleseSerbianShoshoneSierra LeoneanSiouxSlavicSlovakSloveneSomaliSouth AfricanSouth AmericanSouth American IndianSoviet UnionSpaniardSpanishSpanish AmericanSpanish American IndianSri LankanSubsaharan AfricanSudaneseSwedishSwissSyrianTaiwaneseThaiTlingit-HaidaTohono O'OdhamTonganTrinidadian and TobagonianTsimshianTurkishU.S. Virgin IslanderUgandanUkrainianUruguayanUteVenezuelanVietnameseWelshWest IndianYakamaYaquiYugoslavianYumanYup'ikZimbabwean
Immigration
NonimmigrantsImmigrantsAfghanistanAfricaAlbaniaArgentinaArmeniaAsiaAustraliaAustriaBahamasBangladeshBarbadosBelarusBelgiumBelizeBoliviaBosnia and HerzegovinaBrazilBulgariaBurma/MyanmarCabo VerdeCambodiaCameroonCanadaCaribbeanCentral AmericaChileChinaColombiaCongoCosta RicaCroatiaCubaCzechoslovakiaDenmarkDominicaDominican RepublicEastern AfricaEastern AsiaEastern EuropeEcuadorEgyptEl SalvadorEnglandEritreaEthiopiaEuropeFijiFranceGermanyGhanaGreeceGrenadaGuatemalaGuyanaHaitiHondurasHong KongHungaryIndiaIndonesiaIranIraqIrelandIsraelItalyJamaicaJapanJordanKazakhstanKenyaKoreaKuwaitLaosLatin AmericaLatviaLebanonLiberiaLithuaniaMalaysiaMexicoMicronesiaMiddle AfricaMoldovaMoroccoNepalNetherlandsNicaraguaNigeriaNorth AmericaNorth MacedoniaNorthern AfricaNorthern EuropeNorwayOceaniaPakistanPanamaPeruPhilippinesPolandPortugalRomaniaRussiaSaudi ArabiaScotlandSenegalSerbiaSierra LeoneSingaporeSomaliaSouth AfricaSouth AmericaSouth Central AsiaSouth Eastern AsiaSouthern EuropeSpainSri LankaSt. Vincent and the GrenadinesSudanSwedenSwitzerlandSyriaTaiwanThailandTrinidad and TobagoTurkeyUgandaUkraineUruguayUzbekistanVenezuelaVietnamWest IndiesWestern AfricaWestern AsiaWestern EuropeYemenZaireZimbabweAzores
Child Poverty Among Boys Under 16
Income
Poverty
Unemployment
Labor Participation
Family Structure
Vehicle Availability
Education Level
Disability

Child Poverty Among Boys Under 16 Comparison

Kiowa

Iranians

Tragic
Exceptional
21.3%
CHILD POVERTY AMONG BOYS UNDER 16
0.0/ 100
METRIC RATING
305th/ 347
METRIC RANK
12.4%
CHILD POVERTY AMONG BOYS UNDER 16
100.0/ 100
METRIC RATING
7th/ 347
METRIC RANK

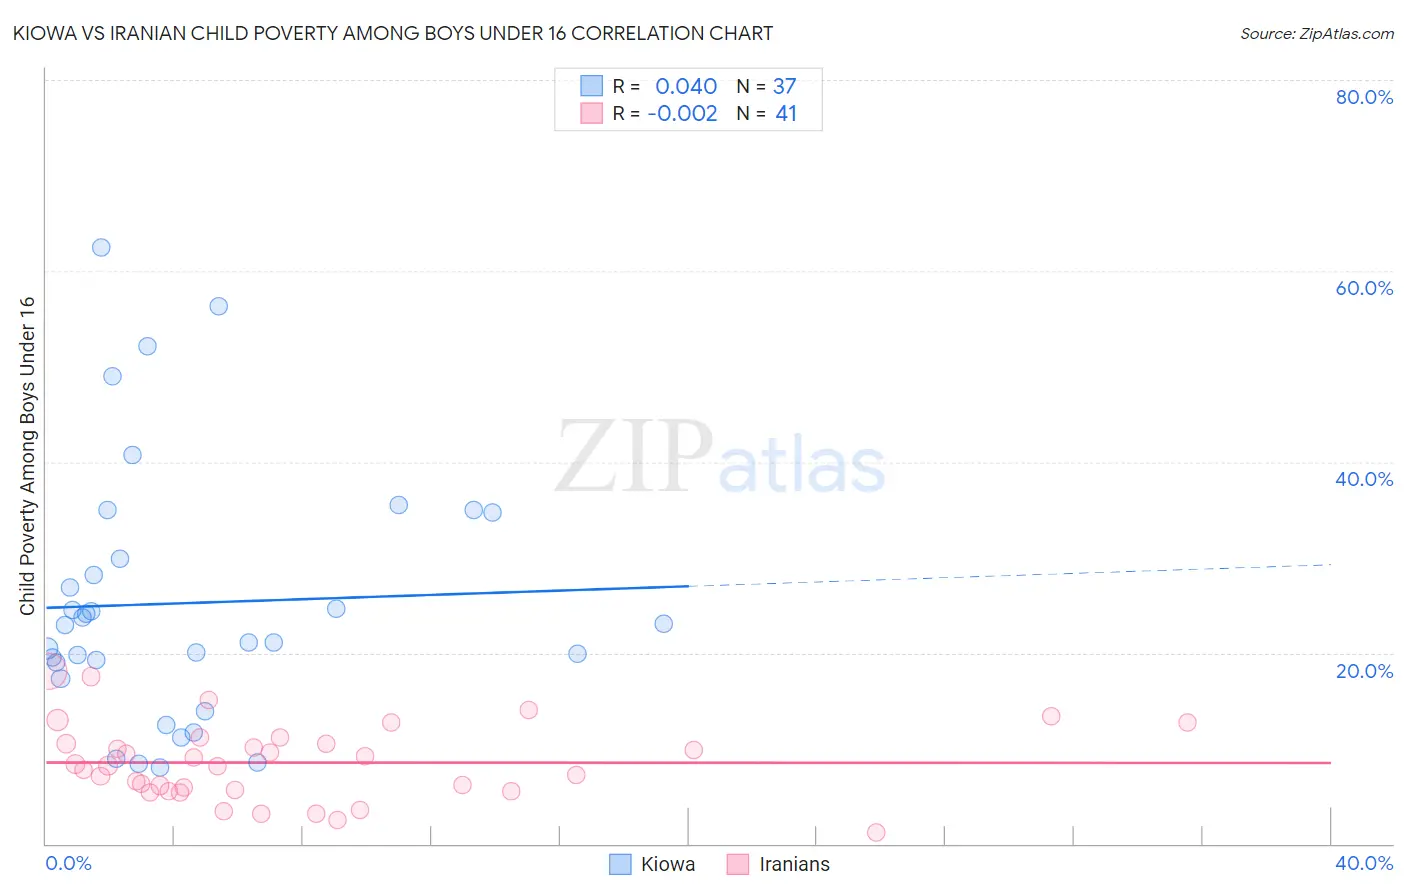
Kiowa vs Iranian Child Poverty Among Boys Under 16 Correlation Chart

The statistical analysis conducted on geographies consisting of 55,969,727 people shows no correlation between the proportion of Kiowa and poverty level among boys under the age of 16 in the United States with a correlation coefficient (R) of 0.040 and weighted average of 21.3%. Similarly, the statistical analysis conducted on geographies consisting of 312,150,992 people shows no correlation between the proportion of Iranians and poverty level among boys under the age of 16 in the United States with a correlation coefficient (R) of -0.002 and weighted average of 12.4%, a difference of 71.2%.
Kiowa vs Iranian Child Poverty Among Boys Under 16

Child Poverty Among Boys Under 16 Correlation Summary

MeasurementKiowaIranian
Minimum8.0%1.2%
Maximum62.5%18.0%
Range54.5%16.8%
Mean25.2%8.5%
Median22.9%8.2%
Interquartile 25% (IQ1)18.1%5.6%
Interquartile 75% (IQ3)32.3%10.8%
Interquartile Range (IQR)14.2%5.2%
Standard Deviation (Sample)13.4%4.0%
Standard Deviation (Population)13.2%3.9%

Similar Demographics by Child Poverty Among Boys Under 16

Demographics Similar to Kiowa by Child Poverty Among Boys Under 16

In terms of child poverty among boys under 16, the demographic groups most similar to Kiowa are Immigrants from Grenada (21.3%, a difference of 0.010%), Choctaw (21.3%, a difference of 0.10%), Immigrants from Central America (21.3%, a difference of 0.17%), Immigrants from Haiti (21.3%, a difference of 0.23%), and Somali (21.1%, a difference of 0.76%).
DemographicsRating | RankChild Poverty Among Boys Under 16
Chippewa
0.0
/100
|
#298
Tragic
21.0%
Immigrants | Caribbean
0.0
/100
|
#299
Tragic
21.0%
Haitians
0.0
/100
|
#300
Tragic
21.0%
Guatemalans
0.0
/100
|
#301
Tragic
21.1%
Somalis
0.0
/100
|
#302
Tragic
21.1%
Immigrants | Haiti
0.0
/100
|
#303
Tragic
21.3%
Immigrants | Central America
0.0
/100
|
#304
Tragic
21.3%
Kiowa
0.0
/100
|
#305
Tragic
21.3%
Immigrants | Grenada
0.0
/100
|
#306
Tragic
21.3%
Choctaw
0.0
/100
|
#307
Tragic
21.3%
Immigrants | Mexico
0.0
/100
|
#308
Tragic
21.5%
Seminole
0.0
/100
|
#309
Tragic
21.5%
Creek
0.0
/100
|
#310
Tragic
21.5%
Bahamians
0.0
/100
|
#311
Tragic
21.6%
Immigrants | Guatemala
0.0
/100
|
#312
Tragic
21.6%

Demographics Similar to Iranians by Child Poverty Among Boys Under 16

In terms of child poverty among boys under 16, the demographic groups most similar to Iranians are Immigrants from Singapore (12.5%, a difference of 0.31%), Immigrants from Iran (12.5%, a difference of 0.81%), Bhutanese (12.6%, a difference of 1.2%), Immigrants from Hong Kong (12.3%, a difference of 1.6%), and Immigrants from South Central Asia (12.7%, a difference of 1.7%).
DemographicsRating | RankChild Poverty Among Boys Under 16
Immigrants | India
100.0
/100
|
#1
Exceptional
10.9%
Immigrants | Taiwan
100.0
/100
|
#2
Exceptional
11.0%
Filipinos
100.0
/100
|
#3
Exceptional
11.1%
Thais
100.0
/100
|
#4
Exceptional
11.7%
Chinese
100.0
/100
|
#5
Exceptional
11.9%
Immigrants | Hong Kong
100.0
/100
|
#6
Exceptional
12.3%
Iranians
100.0
/100
|
#7
Exceptional
12.4%
Immigrants | Singapore
100.0
/100
|
#8
Exceptional
12.5%
Immigrants | Iran
100.0
/100
|
#9
Exceptional
12.5%
Bhutanese
100.0
/100
|
#10
Exceptional
12.6%
Immigrants | South Central Asia
100.0
/100
|
#11
Exceptional
12.7%
Burmese
99.9
/100
|
#12
Exceptional
13.0%
Immigrants | Korea
99.9
/100
|
#13
Exceptional
13.0%
Immigrants | Ireland
99.9
/100
|
#14
Exceptional
13.1%
Immigrants | Japan
99.9
/100
|
#15
Exceptional
13.1%