Kenyan vs Immigrants from Romania Child Poverty Under the Age of 5
COMPARE
Kenyan
Immigrants from Romania
Child Poverty Under the Age of 5
Child Poverty Under the Age of 5 Comparison
Kenyans
Immigrants from Romania
17.5%
CHILD POVERTY UNDER THE AGE OF 5
34.7/ 100
METRIC RATING
187th/ 347
METRIC RANK
15.2%
CHILD POVERTY UNDER THE AGE OF 5
99.1/ 100
METRIC RATING
64th/ 347
METRIC RANK
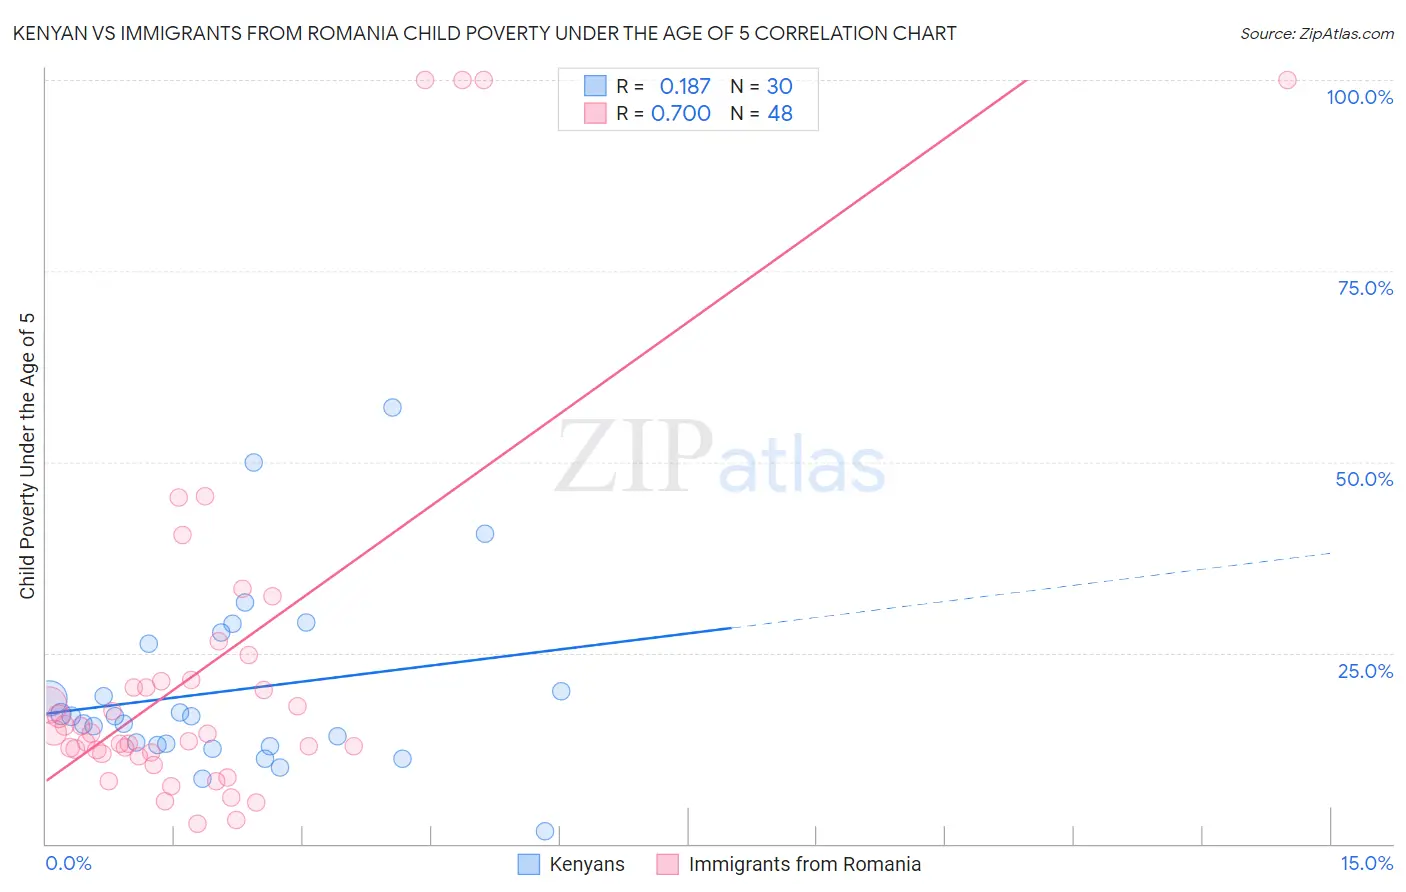
Kenyan vs Immigrants from Romania Child Poverty Under the Age of 5 Correlation Chart
The statistical analysis conducted on geographies consisting of 165,881,160 people shows a poor positive correlation between the proportion of Kenyans and poverty level among children under the age of 5 in the United States with a correlation coefficient (R) of 0.187 and weighted average of 17.5%. Similarly, the statistical analysis conducted on geographies consisting of 248,042,461 people shows a strong positive correlation between the proportion of Immigrants from Romania and poverty level among children under the age of 5 in the United States with a correlation coefficient (R) of 0.700 and weighted average of 15.2%, a difference of 15.6%.
Child Poverty Under the Age of 5 Correlation Summary
| Measurement | Kenyan | Immigrants from Romania |
| Minimum | 1.7% | 2.6% |
| Maximum | 57.1% | 100.0% |
| Range | 55.4% | 97.4% |
| Mean | 20.0% | 23.5% |
| Median | 16.6% | 14.4% |
| Interquartile 25% (IQ1) | 13.0% | 11.9% |
| Interquartile 75% (IQ3) | 26.2% | 21.4% |
| Interquartile Range (IQR) | 13.2% | 9.5% |
| Standard Deviation (Sample) | 12.0% | 25.2% |
| Standard Deviation (Population) | 11.8% | 24.9% |
Similar Demographics by Child Poverty Under the Age of 5
Demographics Similar to Kenyans by Child Poverty Under the Age of 5
In terms of child poverty under the age of 5, the demographic groups most similar to Kenyans are Immigrants from Bosnia and Herzegovina (17.5%, a difference of 0.040%), Carpatho Rusyn (17.5%, a difference of 0.12%), French (17.5%, a difference of 0.12%), Immigrants from Armenia (17.5%, a difference of 0.37%), and Immigrants from Costa Rica (17.4%, a difference of 0.48%).
| Demographics | Rating | Rank | Child Poverty Under the Age of 5 |
| South American Indians | 41.4 /100 | #180 | Average 17.4% |
| Immigrants | Germany | 41.0 /100 | #181 | Average 17.4% |
| Arabs | 40.7 /100 | #182 | Average 17.4% |
| Lebanese | 40.3 /100 | #183 | Average 17.4% |
| Immigrants | Costa Rica | 39.0 /100 | #184 | Fair 17.4% |
| Immigrants | Armenia | 38.0 /100 | #185 | Fair 17.5% |
| Immigrants | Bosnia and Herzegovina | 35.0 /100 | #186 | Fair 17.5% |
| Kenyans | 34.7 /100 | #187 | Fair 17.5% |
| Carpatho Rusyns | 33.6 /100 | #188 | Fair 17.5% |
| French | 33.6 /100 | #189 | Fair 17.5% |
| Slovaks | 29.2 /100 | #190 | Fair 17.6% |
| Immigrants | Afghanistan | 27.9 /100 | #191 | Fair 17.7% |
| Immigrants | Uruguay | 27.8 /100 | #192 | Fair 17.7% |
| Immigrants | Uganda | 25.0 /100 | #193 | Fair 17.7% |
| French Canadians | 24.6 /100 | #194 | Fair 17.7% |
Demographics Similar to Immigrants from Romania by Child Poverty Under the Age of 5
In terms of child poverty under the age of 5, the demographic groups most similar to Immigrants from Romania are Immigrants from Europe (15.1%, a difference of 0.020%), Immigrants from Fiji (15.2%, a difference of 0.030%), Immigrants from Scotland (15.2%, a difference of 0.14%), Immigrants from Eastern Europe (15.1%, a difference of 0.15%), and Greek (15.2%, a difference of 0.21%).
| Demographics | Rating | Rank | Child Poverty Under the Age of 5 |
| Egyptians | 99.4 /100 | #57 | Exceptional 14.9% |
| Swedes | 99.4 /100 | #58 | Exceptional 15.0% |
| Paraguayans | 99.4 /100 | #59 | Exceptional 15.0% |
| Immigrants | Russia | 99.3 /100 | #60 | Exceptional 15.0% |
| Immigrants | Poland | 99.1 /100 | #61 | Exceptional 15.1% |
| Immigrants | Eastern Europe | 99.1 /100 | #62 | Exceptional 15.1% |
| Immigrants | Europe | 99.1 /100 | #63 | Exceptional 15.1% |
| Immigrants | Romania | 99.1 /100 | #64 | Exceptional 15.2% |
| Immigrants | Fiji | 99.0 /100 | #65 | Exceptional 15.2% |
| Immigrants | Scotland | 99.0 /100 | #66 | Exceptional 15.2% |
| Greeks | 99.0 /100 | #67 | Exceptional 15.2% |
| Zimbabweans | 99.0 /100 | #68 | Exceptional 15.2% |
| Lithuanians | 99.0 /100 | #69 | Exceptional 15.2% |
| Immigrants | Belgium | 98.8 /100 | #70 | Exceptional 15.3% |
| Immigrants | Egypt | 98.8 /100 | #71 | Exceptional 15.3% |