Immigrants from Hong Kong vs Immigrants from Romania Child Poverty Under the Age of 5
COMPARE
Immigrants from Hong Kong
Immigrants from Romania
Child Poverty Under the Age of 5
Child Poverty Under the Age of 5 Comparison
Immigrants from Hong Kong
Immigrants from Romania
12.4%
CHILD POVERTY UNDER THE AGE OF 5
100.0/ 100
METRIC RATING
5th/ 347
METRIC RANK
15.2%
CHILD POVERTY UNDER THE AGE OF 5
99.1/ 100
METRIC RATING
64th/ 347
METRIC RANK
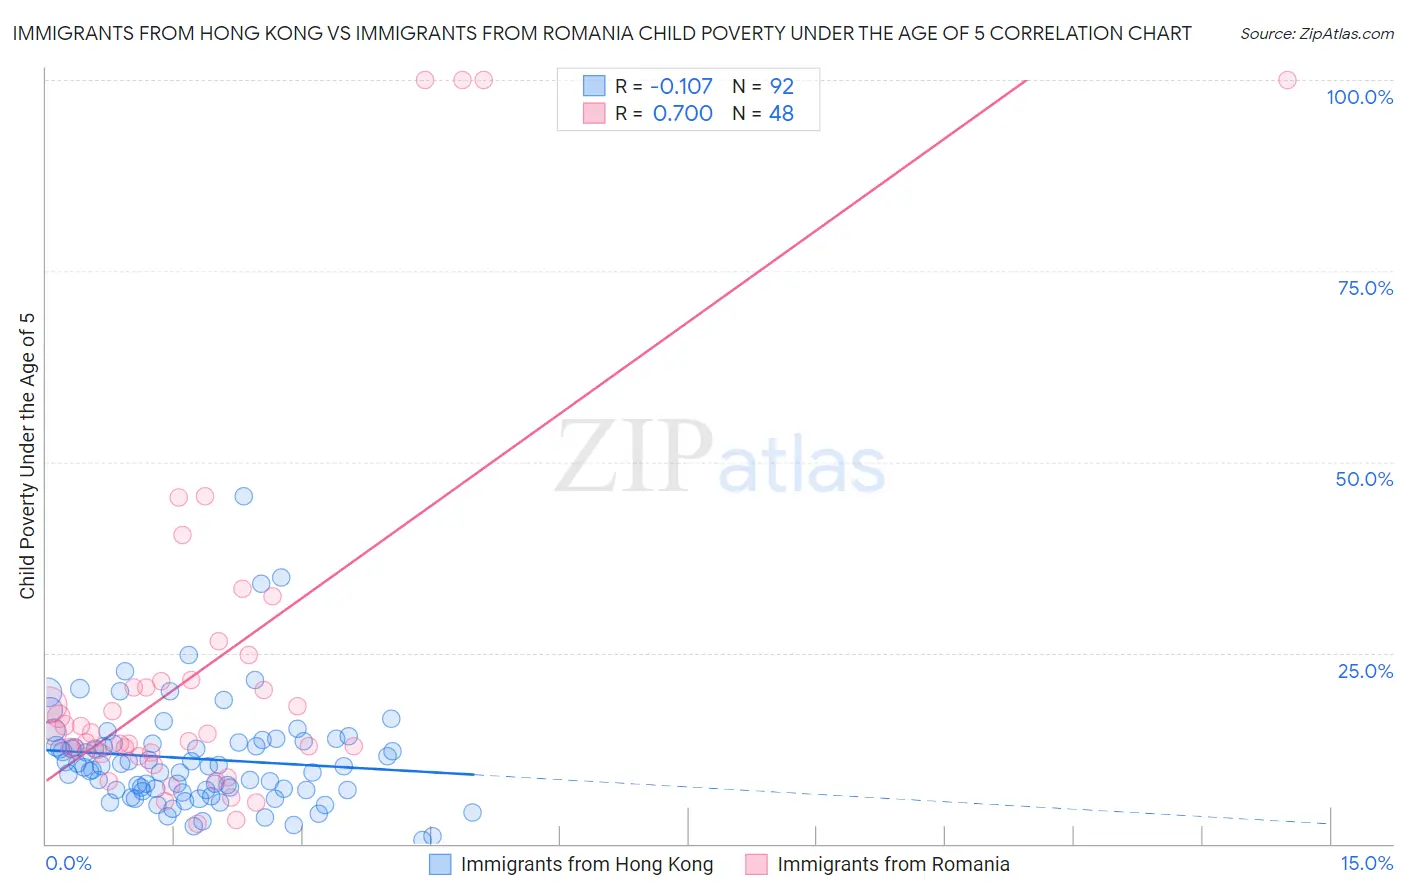
Immigrants from Hong Kong vs Immigrants from Romania Child Poverty Under the Age of 5 Correlation Chart
The statistical analysis conducted on geographies consisting of 244,450,571 people shows a poor negative correlation between the proportion of Immigrants from Hong Kong and poverty level among children under the age of 5 in the United States with a correlation coefficient (R) of -0.107 and weighted average of 12.4%. Similarly, the statistical analysis conducted on geographies consisting of 248,042,461 people shows a strong positive correlation between the proportion of Immigrants from Romania and poverty level among children under the age of 5 in the United States with a correlation coefficient (R) of 0.700 and weighted average of 15.2%, a difference of 21.9%.
Child Poverty Under the Age of 5 Correlation Summary
| Measurement | Immigrants from Hong Kong | Immigrants from Romania |
| Minimum | 0.42% | 2.6% |
| Maximum | 45.5% | 100.0% |
| Range | 45.0% | 97.4% |
| Mean | 11.1% | 23.5% |
| Median | 10.1% | 14.4% |
| Interquartile 25% (IQ1) | 7.0% | 11.9% |
| Interquartile 75% (IQ3) | 13.2% | 21.4% |
| Interquartile Range (IQR) | 6.2% | 9.5% |
| Standard Deviation (Sample) | 7.1% | 25.2% |
| Standard Deviation (Population) | 7.0% | 24.9% |
Similar Demographics by Child Poverty Under the Age of 5
Demographics Similar to Immigrants from Hong Kong by Child Poverty Under the Age of 5
In terms of child poverty under the age of 5, the demographic groups most similar to Immigrants from Hong Kong are Thai (12.3%, a difference of 1.0%), Immigrants from Singapore (12.9%, a difference of 4.0%), Chinese (13.1%, a difference of 5.1%), Iranian (13.1%, a difference of 5.1%), and Immigrants from Iran (13.1%, a difference of 5.2%).
| Demographics | Rating | Rank | Child Poverty Under the Age of 5 |
| Immigrants | India | 100.0 /100 | #1 | Exceptional 11.5% |
| Immigrants | Taiwan | 100.0 /100 | #2 | Exceptional 11.6% |
| Filipinos | 100.0 /100 | #3 | Exceptional 11.6% |
| Thais | 100.0 /100 | #4 | Exceptional 12.3% |
| Immigrants | Hong Kong | 100.0 /100 | #5 | Exceptional 12.4% |
| Immigrants | Singapore | 100.0 /100 | #6 | Exceptional 12.9% |
| Chinese | 100.0 /100 | #7 | Exceptional 13.1% |
| Iranians | 100.0 /100 | #8 | Exceptional 13.1% |
| Immigrants | Iran | 100.0 /100 | #9 | Exceptional 13.1% |
| Burmese | 100.0 /100 | #10 | Exceptional 13.2% |
| Immigrants | Korea | 100.0 /100 | #11 | Exceptional 13.2% |
| Immigrants | South Central Asia | 100.0 /100 | #12 | Exceptional 13.3% |
| Bhutanese | 100.0 /100 | #13 | Exceptional 13.4% |
| Okinawans | 100.0 /100 | #14 | Exceptional 13.4% |
| Indians (Asian) | 100.0 /100 | #15 | Exceptional 13.4% |
Demographics Similar to Immigrants from Romania by Child Poverty Under the Age of 5
In terms of child poverty under the age of 5, the demographic groups most similar to Immigrants from Romania are Immigrants from Europe (15.1%, a difference of 0.020%), Immigrants from Fiji (15.2%, a difference of 0.030%), Immigrants from Scotland (15.2%, a difference of 0.14%), Immigrants from Eastern Europe (15.1%, a difference of 0.15%), and Greek (15.2%, a difference of 0.21%).
| Demographics | Rating | Rank | Child Poverty Under the Age of 5 |
| Egyptians | 99.4 /100 | #57 | Exceptional 14.9% |
| Swedes | 99.4 /100 | #58 | Exceptional 15.0% |
| Paraguayans | 99.4 /100 | #59 | Exceptional 15.0% |
| Immigrants | Russia | 99.3 /100 | #60 | Exceptional 15.0% |
| Immigrants | Poland | 99.1 /100 | #61 | Exceptional 15.1% |
| Immigrants | Eastern Europe | 99.1 /100 | #62 | Exceptional 15.1% |
| Immigrants | Europe | 99.1 /100 | #63 | Exceptional 15.1% |
| Immigrants | Romania | 99.1 /100 | #64 | Exceptional 15.2% |
| Immigrants | Fiji | 99.0 /100 | #65 | Exceptional 15.2% |
| Immigrants | Scotland | 99.0 /100 | #66 | Exceptional 15.2% |
| Greeks | 99.0 /100 | #67 | Exceptional 15.2% |
| Zimbabweans | 99.0 /100 | #68 | Exceptional 15.2% |
| Lithuanians | 99.0 /100 | #69 | Exceptional 15.2% |
| Immigrants | Belgium | 98.8 /100 | #70 | Exceptional 15.3% |
| Immigrants | Egypt | 98.8 /100 | #71 | Exceptional 15.3% |