Iraqi vs Immigrants from Barbados Seniors Poverty Over the Age of 75
COMPARE
Iraqi
Immigrants from Barbados
Seniors Poverty Over the Age of 75
Seniors Poverty Over the Age of 75 Comparison
Iraqis
Immigrants from Barbados
11.7%
SENIORS POVERTY OVER THE AGE OF 75
86.3/ 100
METRIC RATING
116th/ 347
METRIC RANK
16.5%
SENIORS POVERTY OVER THE AGE OF 75
0.0/ 100
METRIC RATING
322nd/ 347
METRIC RANK
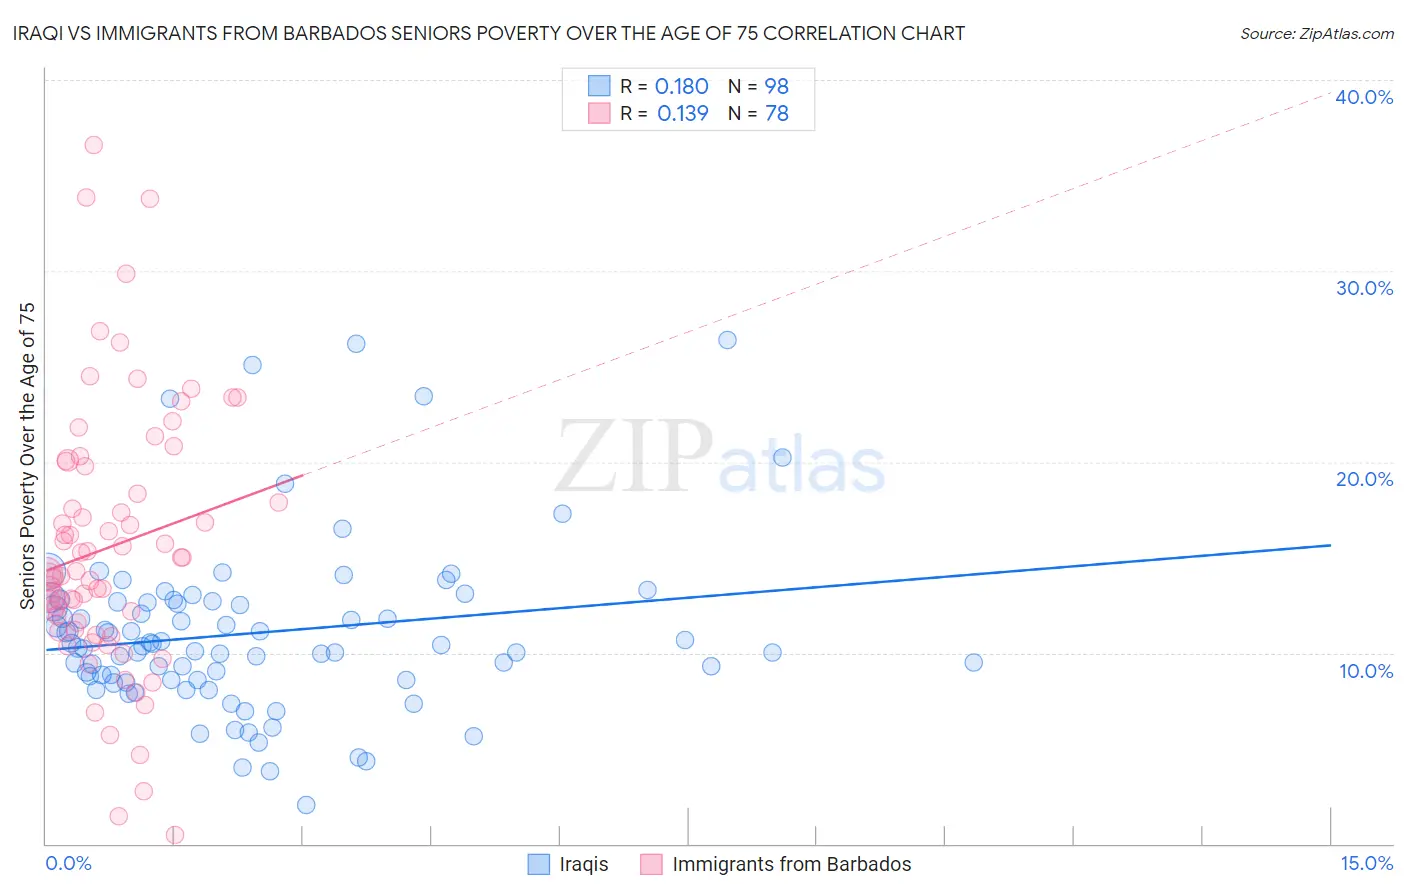
Iraqi vs Immigrants from Barbados Seniors Poverty Over the Age of 75 Correlation Chart
The statistical analysis conducted on geographies consisting of 170,010,208 people shows a poor positive correlation between the proportion of Iraqis and poverty level among seniors over the age of 75 in the United States with a correlation coefficient (R) of 0.180 and weighted average of 11.7%. Similarly, the statistical analysis conducted on geographies consisting of 112,407,452 people shows a poor positive correlation between the proportion of Immigrants from Barbados and poverty level among seniors over the age of 75 in the United States with a correlation coefficient (R) of 0.139 and weighted average of 16.5%, a difference of 40.8%.
Seniors Poverty Over the Age of 75 Correlation Summary
| Measurement | Iraqi | Immigrants from Barbados |
| Minimum | 2.0% | 0.48% |
| Maximum | 26.4% | 36.6% |
| Range | 24.4% | 36.1% |
| Mean | 11.0% | 15.5% |
| Median | 10.4% | 14.2% |
| Interquartile 25% (IQ1) | 8.6% | 11.2% |
| Interquartile 75% (IQ3) | 12.7% | 19.8% |
| Interquartile Range (IQR) | 4.1% | 8.6% |
| Standard Deviation (Sample) | 4.5% | 7.0% |
| Standard Deviation (Population) | 4.4% | 6.9% |
Similar Demographics by Seniors Poverty Over the Age of 75
Demographics Similar to Iraqis by Seniors Poverty Over the Age of 75
In terms of seniors poverty over the age of 75, the demographic groups most similar to Iraqis are New Zealander (11.7%, a difference of 0.0%), Ukrainian (11.7%, a difference of 0.10%), Immigrants from Czechoslovakia (11.7%, a difference of 0.11%), Icelander (11.7%, a difference of 0.11%), and Immigrants from Zimbabwe (11.7%, a difference of 0.14%).
| Demographics | Rating | Rank | Seniors Poverty Over the Age of 75 |
| South Africans | 89.3 /100 | #109 | Excellent 11.7% |
| Immigrants | Jordan | 88.7 /100 | #110 | Excellent 11.7% |
| Burmese | 88.7 /100 | #111 | Excellent 11.7% |
| Immigrants | Bolivia | 88.4 /100 | #112 | Excellent 11.7% |
| Immigrants | Czechoslovakia | 87.0 /100 | #113 | Excellent 11.7% |
| Ukrainians | 86.9 /100 | #114 | Excellent 11.7% |
| New Zealanders | 86.3 /100 | #115 | Excellent 11.7% |
| Iraqis | 86.3 /100 | #116 | Excellent 11.7% |
| Icelanders | 85.7 /100 | #117 | Excellent 11.7% |
| Immigrants | Zimbabwe | 85.5 /100 | #118 | Excellent 11.7% |
| Immigrants | Uganda | 84.8 /100 | #119 | Excellent 11.8% |
| Immigrants | Nepal | 84.5 /100 | #120 | Excellent 11.8% |
| Malaysians | 84.1 /100 | #121 | Excellent 11.8% |
| Pakistanis | 84.0 /100 | #122 | Excellent 11.8% |
| Immigrants | Italy | 84.0 /100 | #123 | Excellent 11.8% |
Demographics Similar to Immigrants from Barbados by Seniors Poverty Over the Age of 75
In terms of seniors poverty over the age of 75, the demographic groups most similar to Immigrants from Barbados are Immigrants from Haiti (16.5%, a difference of 0.020%), Central American Indian (16.5%, a difference of 0.090%), Immigrants from Uzbekistan (16.5%, a difference of 0.14%), Immigrants from Yemen (16.5%, a difference of 0.21%), and Nicaraguan (16.6%, a difference of 0.52%).
| Demographics | Rating | Rank | Seniors Poverty Over the Age of 75 |
| Guyanese | 0.0 /100 | #315 | Tragic 16.1% |
| Immigrants | Ecuador | 0.0 /100 | #316 | Tragic 16.1% |
| Immigrants | Guyana | 0.0 /100 | #317 | Tragic 16.2% |
| Houma | 0.0 /100 | #318 | Tragic 16.2% |
| Haitians | 0.0 /100 | #319 | Tragic 16.2% |
| Immigrants | Yemen | 0.0 /100 | #320 | Tragic 16.5% |
| Immigrants | Haiti | 0.0 /100 | #321 | Tragic 16.5% |
| Immigrants | Barbados | 0.0 /100 | #322 | Tragic 16.5% |
| Central American Indians | 0.0 /100 | #323 | Tragic 16.5% |
| Immigrants | Uzbekistan | 0.0 /100 | #324 | Tragic 16.5% |
| Nicaraguans | 0.0 /100 | #325 | Tragic 16.6% |
| Pueblo | 0.0 /100 | #326 | Tragic 16.7% |
| Sioux | 0.0 /100 | #327 | Tragic 16.8% |
| Cape Verdeans | 0.0 /100 | #328 | Tragic 16.8% |
| Immigrants | Dominica | 0.0 /100 | #329 | Tragic 17.0% |