Iranian vs Immigrants from Uzbekistan Seniors Poverty Over the Age of 75
COMPARE
Iranian
Immigrants from Uzbekistan
Seniors Poverty Over the Age of 75
Seniors Poverty Over the Age of 75 Comparison
Iranians
Immigrants from Uzbekistan
11.5%
SENIORS POVERTY OVER THE AGE OF 75
95.1/ 100
METRIC RATING
82nd/ 347
METRIC RANK
16.5%
SENIORS POVERTY OVER THE AGE OF 75
0.0/ 100
METRIC RATING
324th/ 347
METRIC RANK
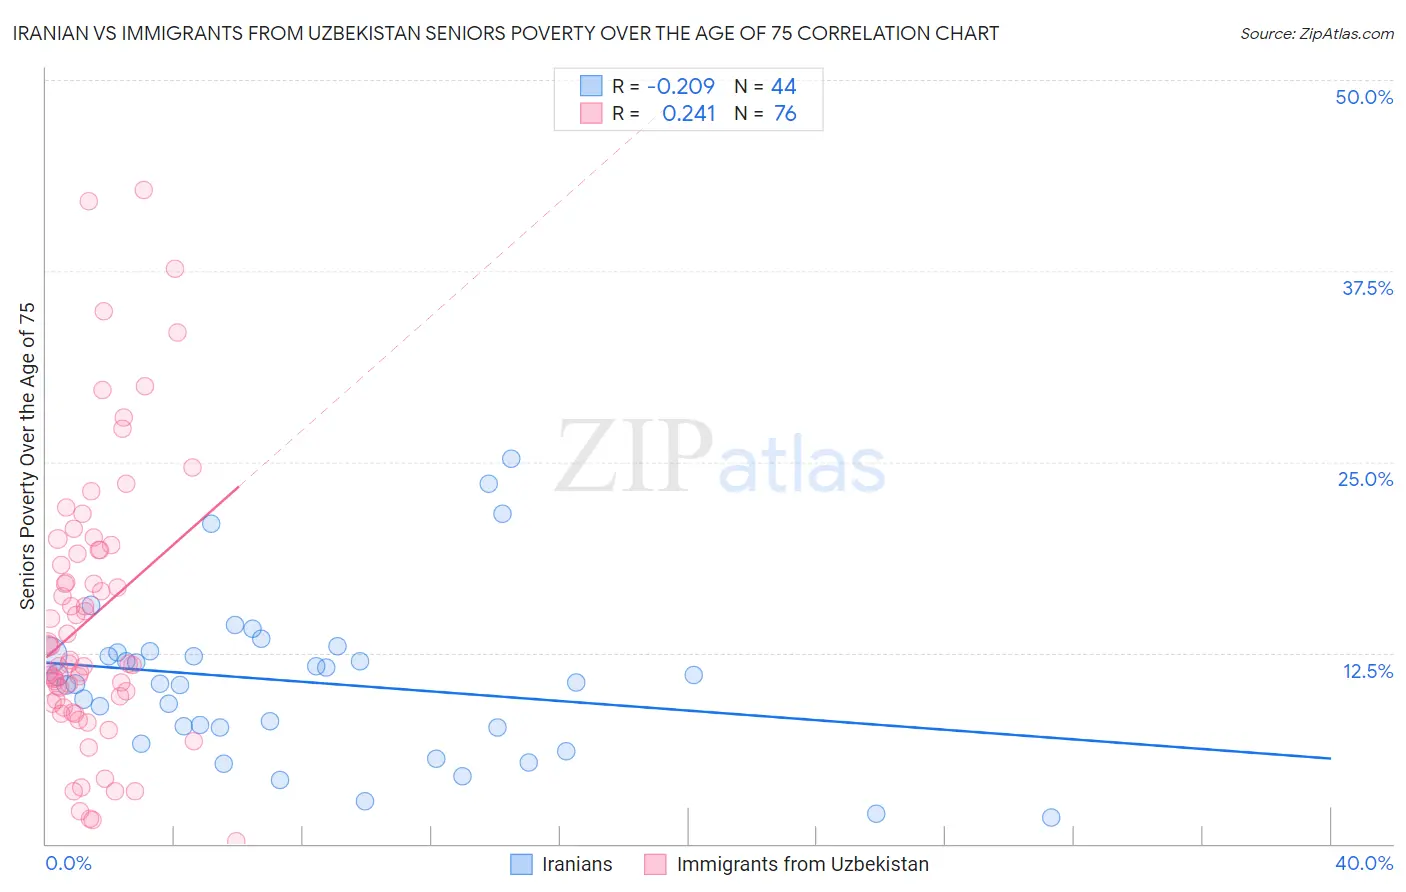
Iranian vs Immigrants from Uzbekistan Seniors Poverty Over the Age of 75 Correlation Chart
The statistical analysis conducted on geographies consisting of 314,002,652 people shows a weak negative correlation between the proportion of Iranians and poverty level among seniors over the age of 75 in the United States with a correlation coefficient (R) of -0.209 and weighted average of 11.5%. Similarly, the statistical analysis conducted on geographies consisting of 118,161,446 people shows a weak positive correlation between the proportion of Immigrants from Uzbekistan and poverty level among seniors over the age of 75 in the United States with a correlation coefficient (R) of 0.241 and weighted average of 16.5%, a difference of 44.5%.
Seniors Poverty Over the Age of 75 Correlation Summary
| Measurement | Iranian | Immigrants from Uzbekistan |
| Minimum | 1.7% | 0.17% |
| Maximum | 25.2% | 42.8% |
| Range | 23.4% | 42.6% |
| Mean | 10.6% | 14.8% |
| Median | 10.5% | 11.9% |
| Interquartile 25% (IQ1) | 7.6% | 9.3% |
| Interquartile 75% (IQ3) | 12.4% | 19.2% |
| Interquartile Range (IQR) | 4.8% | 9.9% |
| Standard Deviation (Sample) | 5.2% | 9.1% |
| Standard Deviation (Population) | 5.1% | 9.1% |
Similar Demographics by Seniors Poverty Over the Age of 75
Demographics Similar to Iranians by Seniors Poverty Over the Age of 75
In terms of seniors poverty over the age of 75, the demographic groups most similar to Iranians are Basque (11.5%, a difference of 0.010%), Immigrants from South Africa (11.5%, a difference of 0.080%), Immigrants from Iraq (11.5%, a difference of 0.090%), Alaska Native (11.4%, a difference of 0.13%), and Macedonian (11.4%, a difference of 0.19%).
| Demographics | Rating | Rank | Seniors Poverty Over the Age of 75 |
| Palestinians | 95.8 /100 | #75 | Exceptional 11.4% |
| French Canadians | 95.7 /100 | #76 | Exceptional 11.4% |
| Whites/Caucasians | 95.5 /100 | #77 | Exceptional 11.4% |
| Macedonians | 95.5 /100 | #78 | Exceptional 11.4% |
| Filipinos | 95.5 /100 | #79 | Exceptional 11.4% |
| Alaska Natives | 95.4 /100 | #80 | Exceptional 11.4% |
| Basques | 95.1 /100 | #81 | Exceptional 11.5% |
| Iranians | 95.1 /100 | #82 | Exceptional 11.5% |
| Immigrants | South Africa | 94.9 /100 | #83 | Exceptional 11.5% |
| Immigrants | Iraq | 94.9 /100 | #84 | Exceptional 11.5% |
| Immigrants | Bulgaria | 94.7 /100 | #85 | Exceptional 11.5% |
| Australians | 94.6 /100 | #86 | Exceptional 11.5% |
| Koreans | 94.5 /100 | #87 | Exceptional 11.5% |
| Immigrants | Croatia | 94.5 /100 | #88 | Exceptional 11.5% |
| Immigrants | Sri Lanka | 94.4 /100 | #89 | Exceptional 11.5% |
Demographics Similar to Immigrants from Uzbekistan by Seniors Poverty Over the Age of 75
In terms of seniors poverty over the age of 75, the demographic groups most similar to Immigrants from Uzbekistan are Central American Indian (16.5%, a difference of 0.050%), Immigrants from Barbados (16.5%, a difference of 0.14%), Immigrants from Haiti (16.5%, a difference of 0.16%), Immigrants from Yemen (16.5%, a difference of 0.35%), and Nicaraguan (16.6%, a difference of 0.38%).
| Demographics | Rating | Rank | Seniors Poverty Over the Age of 75 |
| Immigrants | Guyana | 0.0 /100 | #317 | Tragic 16.2% |
| Houma | 0.0 /100 | #318 | Tragic 16.2% |
| Haitians | 0.0 /100 | #319 | Tragic 16.2% |
| Immigrants | Yemen | 0.0 /100 | #320 | Tragic 16.5% |
| Immigrants | Haiti | 0.0 /100 | #321 | Tragic 16.5% |
| Immigrants | Barbados | 0.0 /100 | #322 | Tragic 16.5% |
| Central American Indians | 0.0 /100 | #323 | Tragic 16.5% |
| Immigrants | Uzbekistan | 0.0 /100 | #324 | Tragic 16.5% |
| Nicaraguans | 0.0 /100 | #325 | Tragic 16.6% |
| Pueblo | 0.0 /100 | #326 | Tragic 16.7% |
| Sioux | 0.0 /100 | #327 | Tragic 16.8% |
| Cape Verdeans | 0.0 /100 | #328 | Tragic 16.8% |
| Immigrants | Dominica | 0.0 /100 | #329 | Tragic 17.0% |
| British West Indians | 0.0 /100 | #330 | Tragic 17.4% |
| Immigrants | Armenia | 0.0 /100 | #331 | Tragic 17.5% |