Immigrants from Western Europe vs Immigrants from Bosnia and Herzegovina Family Poverty
COMPARE
Immigrants from Western Europe
Immigrants from Bosnia and Herzegovina
Family Poverty
Family Poverty Comparison
Immigrants from Western Europe
Immigrants from Bosnia and Herzegovina
8.2%
FAMILY POVERTY
92.9/ 100
METRIC RATING
118th/ 347
METRIC RANK
8.4%
FAMILY POVERTY
88.6/ 100
METRIC RATING
130th/ 347
METRIC RANK
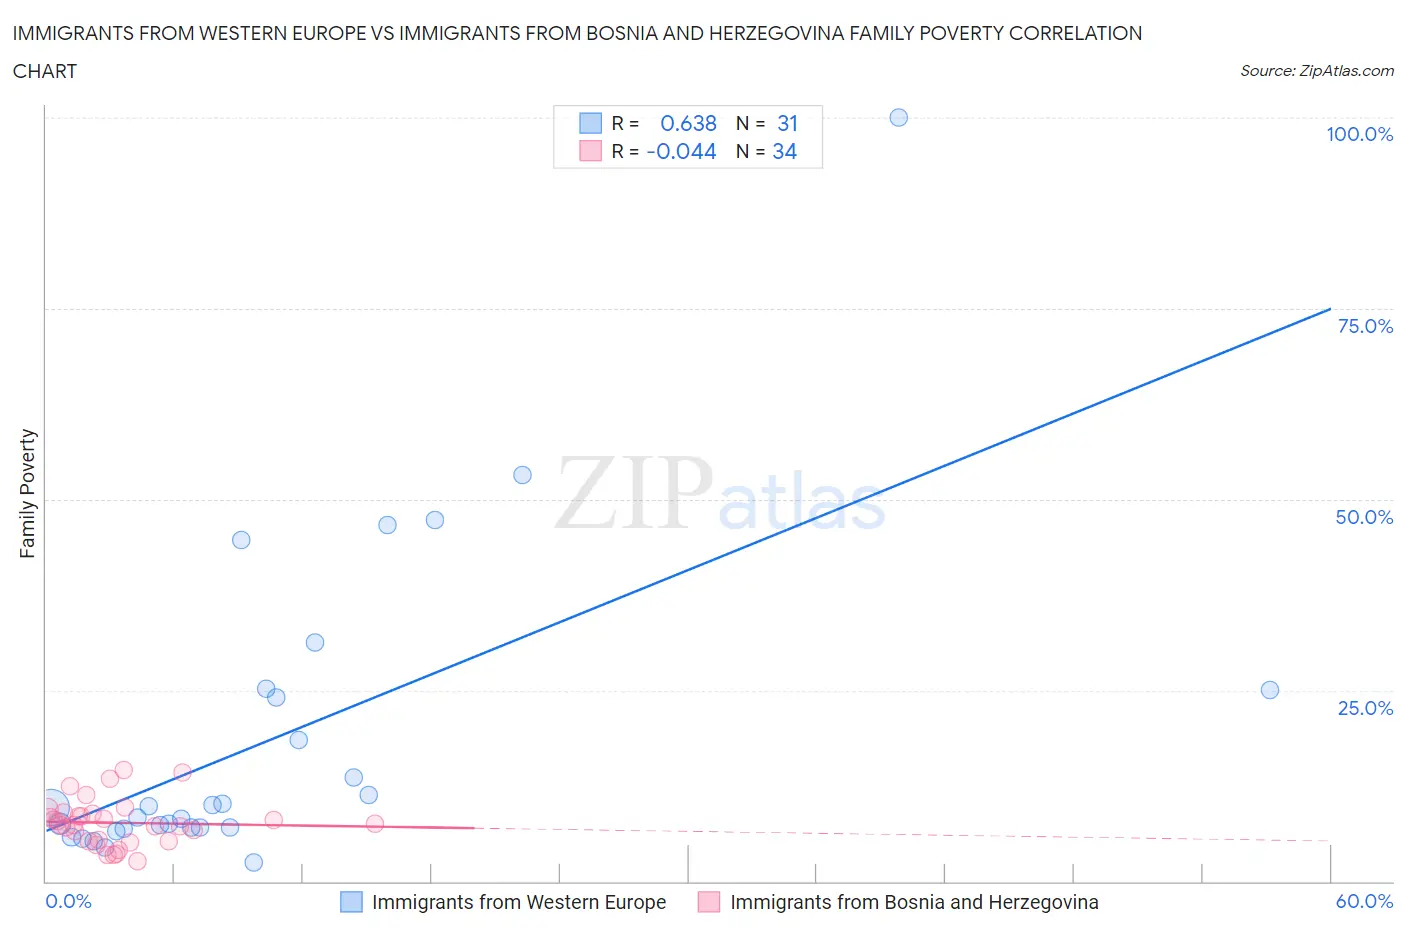
Immigrants from Western Europe vs Immigrants from Bosnia and Herzegovina Family Poverty Correlation Chart
The statistical analysis conducted on geographies consisting of 491,859,652 people shows a significant positive correlation between the proportion of Immigrants from Western Europe and poverty level among families in the United States with a correlation coefficient (R) of 0.638 and weighted average of 8.2%. Similarly, the statistical analysis conducted on geographies consisting of 156,590,681 people shows no correlation between the proportion of Immigrants from Bosnia and Herzegovina and poverty level among families in the United States with a correlation coefficient (R) of -0.044 and weighted average of 8.4%, a difference of 1.8%.
Family Poverty Correlation Summary
| Measurement | Immigrants from Western Europe | Immigrants from Bosnia and Herzegovina |
| Minimum | 2.5% | 2.7% |
| Maximum | 100.0% | 14.6% |
| Range | 97.5% | 11.9% |
| Mean | 18.6% | 7.7% |
| Median | 9.6% | 7.5% |
| Interquartile 25% (IQ1) | 7.0% | 5.3% |
| Interquartile 75% (IQ3) | 25.0% | 8.8% |
| Interquartile Range (IQR) | 18.0% | 3.5% |
| Standard Deviation (Sample) | 20.8% | 3.0% |
| Standard Deviation (Population) | 20.5% | 3.0% |
Demographics Similar to Immigrants from Western Europe and Immigrants from Bosnia and Herzegovina by Family Poverty
In terms of family poverty, the demographic groups most similar to Immigrants from Western Europe are French (8.3%, a difference of 0.070%), Immigrants from Russia (8.2%, a difference of 0.19%), South African (8.2%, a difference of 0.26%), Immigrants from Israel (8.2%, a difference of 0.32%), and Immigrants from Egypt (8.3%, a difference of 0.63%). Similarly, the demographic groups most similar to Immigrants from Bosnia and Herzegovina are Puget Sound Salish (8.4%, a difference of 0.010%), Immigrants from Argentina (8.4%, a difference of 0.16%), Portuguese (8.4%, a difference of 0.18%), Argentinean (8.4%, a difference of 0.34%), and Immigrants from Hungary (8.4%, a difference of 0.48%).
| Demographics | Rating | Rank | Family Poverty |
| Immigrants | Zimbabwe | 94.0 /100 | #114 | Exceptional 8.2% |
| Immigrants | Israel | 93.5 /100 | #115 | Exceptional 8.2% |
| South Africans | 93.4 /100 | #116 | Exceptional 8.2% |
| Immigrants | Russia | 93.2 /100 | #117 | Exceptional 8.2% |
| Immigrants | Western Europe | 92.9 /100 | #118 | Exceptional 8.2% |
| French | 92.8 /100 | #119 | Exceptional 8.3% |
| Immigrants | Egypt | 91.6 /100 | #120 | Exceptional 8.3% |
| Native Hawaiians | 91.3 /100 | #121 | Exceptional 8.3% |
| Paraguayans | 91.2 /100 | #122 | Exceptional 8.3% |
| Palestinians | 91.1 /100 | #123 | Exceptional 8.3% |
| Soviet Union | 90.8 /100 | #124 | Exceptional 8.3% |
| Pakistanis | 90.8 /100 | #125 | Exceptional 8.3% |
| Icelanders | 90.3 /100 | #126 | Exceptional 8.3% |
| Immigrants | Hungary | 89.9 /100 | #127 | Excellent 8.4% |
| Argentineans | 89.6 /100 | #128 | Excellent 8.4% |
| Portuguese | 89.2 /100 | #129 | Excellent 8.4% |
| Immigrants | Bosnia and Herzegovina | 88.6 /100 | #130 | Excellent 8.4% |
| Puget Sound Salish | 88.6 /100 | #131 | Excellent 8.4% |
| Immigrants | Argentina | 88.2 /100 | #132 | Excellent 8.4% |
| Sri Lankans | 86.6 /100 | #133 | Excellent 8.5% |
| Chileans | 86.6 /100 | #134 | Excellent 8.5% |