Immigrants from Western Europe vs Assyrian/Chaldean/Syriac Single Mother Poverty
COMPARE
Immigrants from Western Europe
Assyrian/Chaldean/Syriac
Single Mother Poverty
Single Mother Poverty Comparison
Immigrants from Western Europe
Assyrians/Chaldeans/Syriacs
28.9%
SINGLE MOTHER POVERTY
71.1/ 100
METRIC RATING
157th/ 347
METRIC RANK
23.8%
SINGLE MOTHER POVERTY
100.0/ 100
METRIC RATING
1st/ 347
METRIC RANK
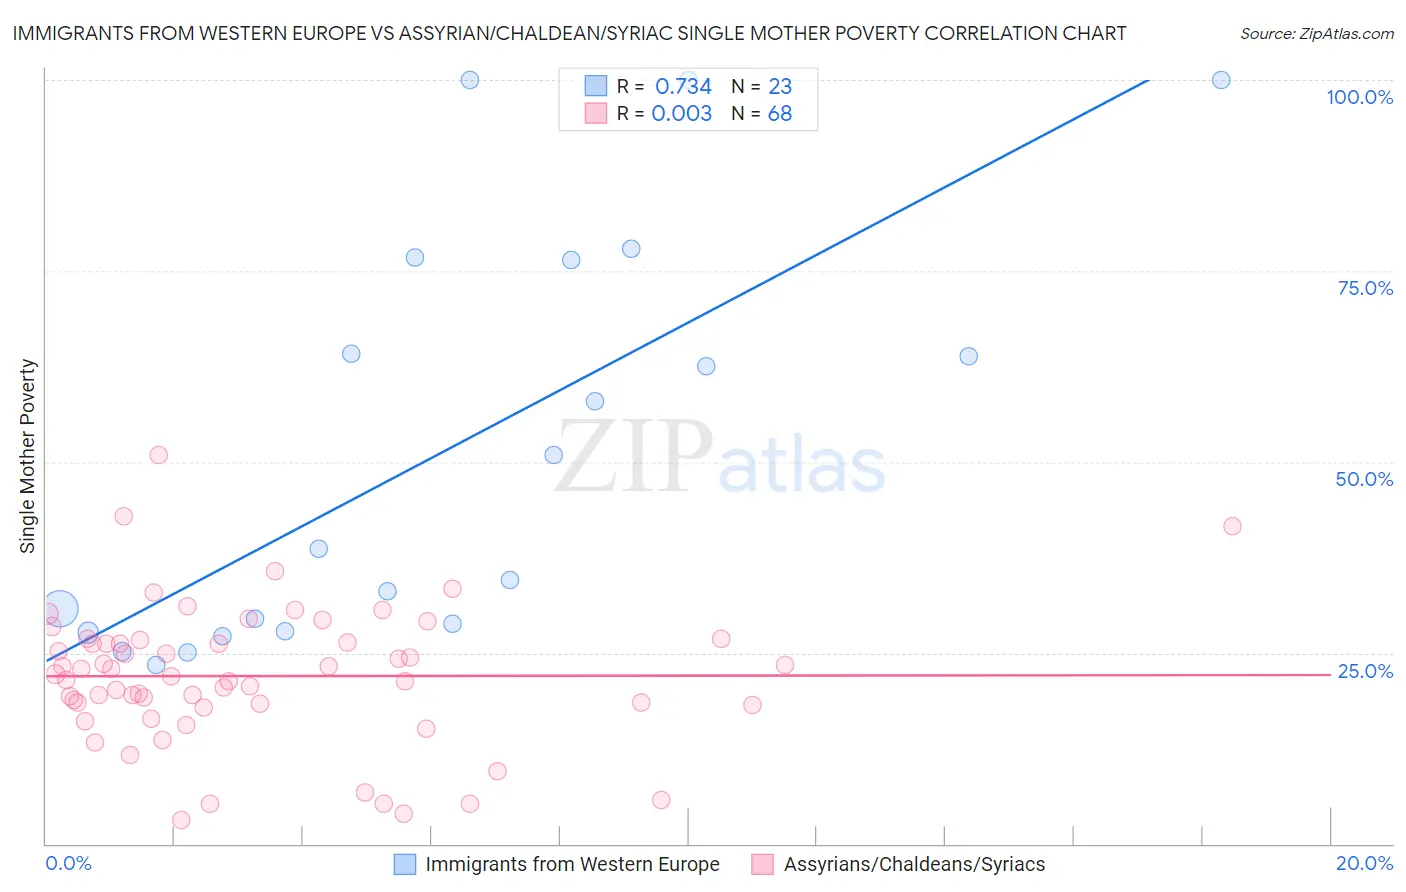
Immigrants from Western Europe vs Assyrian/Chaldean/Syriac Single Mother Poverty Correlation Chart
The statistical analysis conducted on geographies consisting of 476,604,717 people shows a strong positive correlation between the proportion of Immigrants from Western Europe and poverty level among single mothers in the United States with a correlation coefficient (R) of 0.734 and weighted average of 28.9%. Similarly, the statistical analysis conducted on geographies consisting of 109,112,991 people shows no correlation between the proportion of Assyrians/Chaldeans/Syriacs and poverty level among single mothers in the United States with a correlation coefficient (R) of 0.003 and weighted average of 23.8%, a difference of 21.2%.
Single Mother Poverty Correlation Summary
| Measurement | Immigrants from Western Europe | Assyrian/Chaldean/Syriac |
| Minimum | 23.4% | 3.1% |
| Maximum | 100.0% | 50.9% |
| Range | 76.6% | 47.8% |
| Mean | 51.4% | 22.0% |
| Median | 38.6% | 22.1% |
| Interquartile 25% (IQ1) | 27.9% | 18.2% |
| Interquartile 75% (IQ3) | 76.4% | 26.5% |
| Interquartile Range (IQR) | 48.5% | 8.3% |
| Standard Deviation (Sample) | 26.6% | 9.1% |
| Standard Deviation (Population) | 26.1% | 9.0% |
Similar Demographics by Single Mother Poverty
Demographics Similar to Immigrants from Western Europe by Single Mother Poverty
In terms of single mother poverty, the demographic groups most similar to Immigrants from Western Europe are Iraqi (28.8%, a difference of 0.030%), Immigrants from Hungary (28.9%, a difference of 0.030%), Ugandan (28.8%, a difference of 0.040%), Portuguese (28.8%, a difference of 0.13%), and Czech (28.9%, a difference of 0.15%).
| Demographics | Rating | Rank | Single Mother Poverty |
| Northern Europeans | 81.7 /100 | #150 | Excellent 28.6% |
| Immigrants | Oceania | 79.9 /100 | #151 | Good 28.7% |
| Austrians | 79.0 /100 | #152 | Good 28.7% |
| Slovenes | 76.4 /100 | #153 | Good 28.8% |
| Portuguese | 73.2 /100 | #154 | Good 28.8% |
| Ugandans | 71.7 /100 | #155 | Good 28.8% |
| Iraqis | 71.5 /100 | #156 | Good 28.8% |
| Immigrants | Western Europe | 71.1 /100 | #157 | Good 28.9% |
| Immigrants | Hungary | 70.6 /100 | #158 | Good 28.9% |
| Czechs | 68.4 /100 | #159 | Good 28.9% |
| Japanese | 68.0 /100 | #160 | Good 28.9% |
| Immigrants | Cambodia | 66.6 /100 | #161 | Good 28.9% |
| Scandinavians | 66.2 /100 | #162 | Good 28.9% |
| Immigrants | Nigeria | 65.9 /100 | #163 | Good 28.9% |
| Immigrants | Kenya | 65.9 /100 | #164 | Good 28.9% |
Demographics Similar to Assyrians/Chaldeans/Syriacs by Single Mother Poverty
In terms of single mother poverty, the demographic groups most similar to Assyrians/Chaldeans/Syriacs are Immigrants from India (23.8%, a difference of 0.020%), Immigrants from Taiwan (23.9%, a difference of 0.21%), Filipino (24.3%, a difference of 2.1%), Immigrants from Hong Kong (24.4%, a difference of 2.4%), and Thai (24.5%, a difference of 2.9%).
| Demographics | Rating | Rank | Single Mother Poverty |
| Assyrians/Chaldeans/Syriacs | 100.0 /100 | #1 | Exceptional 23.8% |
| Immigrants | India | 100.0 /100 | #2 | Exceptional 23.8% |
| Immigrants | Taiwan | 100.0 /100 | #3 | Exceptional 23.9% |
| Filipinos | 100.0 /100 | #4 | Exceptional 24.3% |
| Immigrants | Hong Kong | 100.0 /100 | #5 | Exceptional 24.4% |
| Thais | 100.0 /100 | #6 | Exceptional 24.5% |
| Chinese | 100.0 /100 | #7 | Exceptional 24.6% |
| Immigrants | Iran | 100.0 /100 | #8 | Exceptional 25.1% |
| Immigrants | Lithuania | 100.0 /100 | #9 | Exceptional 25.2% |
| Immigrants | South Central Asia | 100.0 /100 | #10 | Exceptional 25.3% |
| Iranians | 100.0 /100 | #11 | Exceptional 25.5% |
| Bhutanese | 100.0 /100 | #12 | Exceptional 25.6% |
| Indians (Asian) | 100.0 /100 | #13 | Exceptional 25.8% |
| Immigrants | Singapore | 100.0 /100 | #14 | Exceptional 25.8% |
| Immigrants | Ireland | 100.0 /100 | #15 | Exceptional 25.8% |