Immigrants from Western Asia vs Paiute Female Poverty Among 25-34 Year Olds
COMPARE
Immigrants from Western Asia
Paiute
Female Poverty Among 25-34 Year Olds
Female Poverty Among 25-34 Year Olds Comparison
Immigrants from Western Asia
Paiute
12.8%
FEMALE POVERTY AMONG 25-34 YEAR OLDS
92.7/ 100
METRIC RATING
122nd/ 347
METRIC RANK
19.6%
FEMALE POVERTY AMONG 25-34 YEAR OLDS
0.0/ 100
METRIC RATING
330th/ 347
METRIC RANK
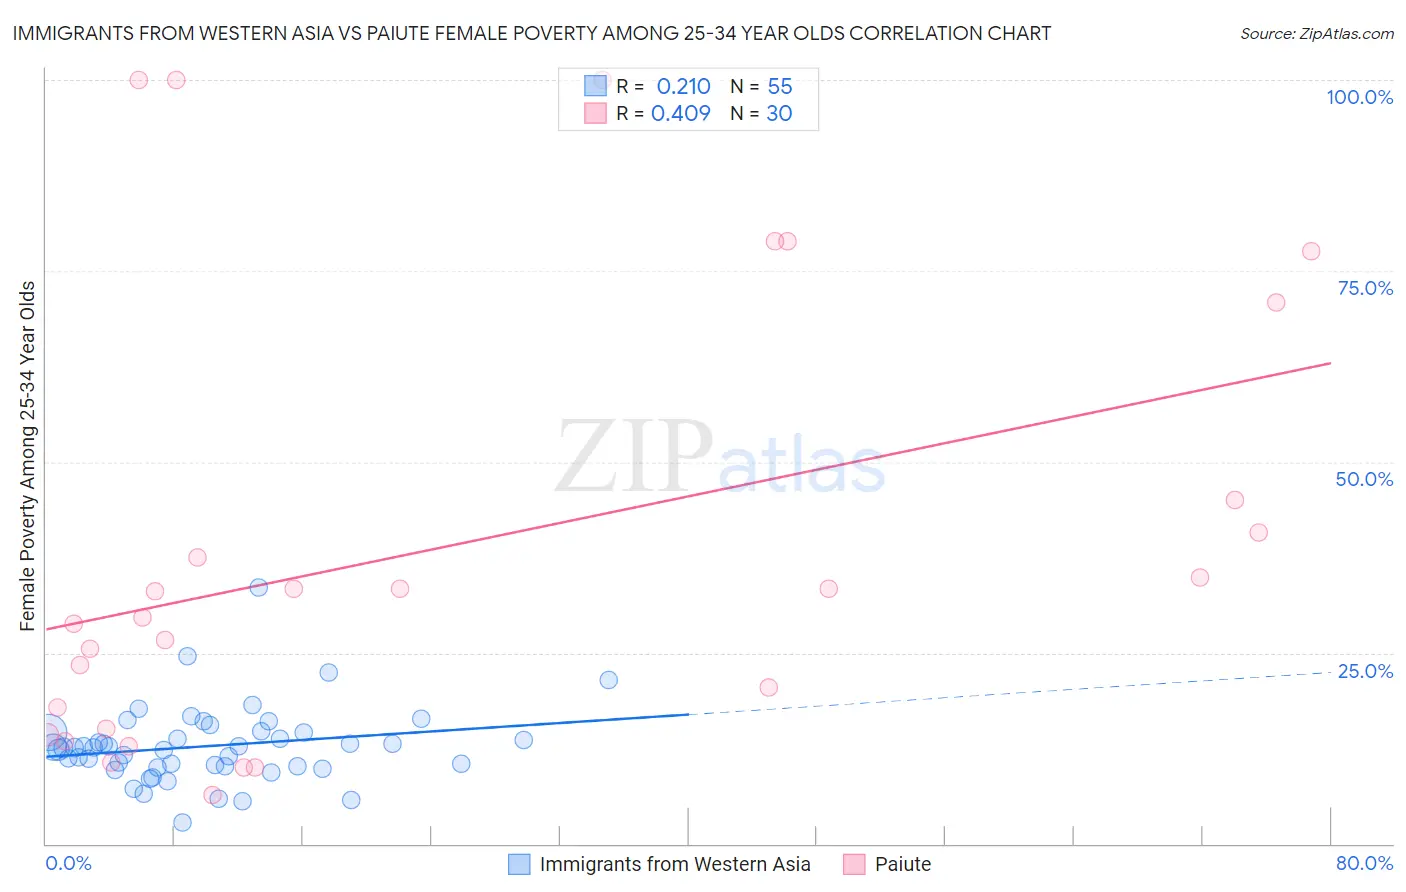
Immigrants from Western Asia vs Paiute Female Poverty Among 25-34 Year Olds Correlation Chart
The statistical analysis conducted on geographies consisting of 397,039,286 people shows a weak positive correlation between the proportion of Immigrants from Western Asia and poverty level among females between the ages 25 and 34 in the United States with a correlation coefficient (R) of 0.210 and weighted average of 12.8%. Similarly, the statistical analysis conducted on geographies consisting of 58,229,271 people shows a moderate positive correlation between the proportion of Paiute and poverty level among females between the ages 25 and 34 in the United States with a correlation coefficient (R) of 0.409 and weighted average of 19.6%, a difference of 52.8%.
Female Poverty Among 25-34 Year Olds Correlation Summary
| Measurement | Immigrants from Western Asia | Paiute |
| Minimum | 2.9% | 6.4% |
| Maximum | 33.5% | 100.0% |
| Range | 30.6% | 93.6% |
| Mean | 12.8% | 38.7% |
| Median | 12.6% | 31.4% |
| Interquartile 25% (IQ1) | 10.1% | 15.1% |
| Interquartile 75% (IQ3) | 14.6% | 45.1% |
| Interquartile Range (IQR) | 4.5% | 30.0% |
| Standard Deviation (Sample) | 5.0% | 29.2% |
| Standard Deviation (Population) | 4.9% | 28.7% |
Similar Demographics by Female Poverty Among 25-34 Year Olds
Demographics Similar to Immigrants from Western Asia by Female Poverty Among 25-34 Year Olds
In terms of female poverty among 25-34 year olds, the demographic groups most similar to Immigrants from Western Asia are Romanian (12.8%, a difference of 0.020%), Slovene (12.8%, a difference of 0.020%), Carpatho Rusyn (12.8%, a difference of 0.080%), Immigrants from Nepal (12.8%, a difference of 0.090%), and Mongolian (12.8%, a difference of 0.10%).
| Demographics | Rating | Rank | Female Poverty Among 25-34 Year Olds |
| Immigrants | Brazil | 93.3 /100 | #115 | Exceptional 12.8% |
| Chileans | 93.2 /100 | #116 | Exceptional 12.8% |
| Immigrants | Kuwait | 93.1 /100 | #117 | Exceptional 12.8% |
| Mongolians | 93.0 /100 | #118 | Exceptional 12.8% |
| Immigrants | Nepal | 93.0 /100 | #119 | Exceptional 12.8% |
| Carpatho Rusyns | 93.0 /100 | #120 | Exceptional 12.8% |
| Romanians | 92.8 /100 | #121 | Exceptional 12.8% |
| Immigrants | Western Asia | 92.7 /100 | #122 | Exceptional 12.8% |
| Slovenes | 92.7 /100 | #123 | Exceptional 12.8% |
| Immigrants | Netherlands | 92.0 /100 | #124 | Exceptional 12.8% |
| Immigrants | Canada | 91.5 /100 | #125 | Exceptional 12.9% |
| Immigrants | Fiji | 91.2 /100 | #126 | Exceptional 12.9% |
| Czechs | 90.3 /100 | #127 | Exceptional 12.9% |
| Syrians | 90.2 /100 | #128 | Exceptional 12.9% |
| Immigrants | North America | 89.7 /100 | #129 | Excellent 12.9% |
Demographics Similar to Paiute by Female Poverty Among 25-34 Year Olds
In terms of female poverty among 25-34 year olds, the demographic groups most similar to Paiute are Kiowa (19.7%, a difference of 0.42%), Immigrants from Yemen (19.8%, a difference of 1.0%), Cajun (19.9%, a difference of 1.8%), Creek (19.2%, a difference of 2.2%), and Alaskan Athabascan (19.1%, a difference of 2.5%).
| Demographics | Rating | Rank | Female Poverty Among 25-34 Year Olds |
| Seminole | 0.0 /100 | #323 | Tragic 18.3% |
| Dutch West Indians | 0.0 /100 | #324 | Tragic 18.4% |
| Inupiat | 0.0 /100 | #325 | Tragic 18.5% |
| Blacks/African Americans | 0.0 /100 | #326 | Tragic 18.9% |
| Cheyenne | 0.0 /100 | #327 | Tragic 19.1% |
| Alaskan Athabascans | 0.0 /100 | #328 | Tragic 19.1% |
| Creek | 0.0 /100 | #329 | Tragic 19.2% |
| Paiute | 0.0 /100 | #330 | Tragic 19.6% |
| Kiowa | 0.0 /100 | #331 | Tragic 19.7% |
| Immigrants | Yemen | 0.0 /100 | #332 | Tragic 19.8% |
| Cajuns | 0.0 /100 | #333 | Tragic 19.9% |
| Apache | 0.0 /100 | #334 | Tragic 20.1% |
| Natives/Alaskans | 0.0 /100 | #335 | Tragic 20.3% |
| Pueblo | 0.0 /100 | #336 | Tragic 22.2% |
| Crow | 0.0 /100 | #337 | Tragic 22.7% |