Immigrants from Western Africa vs Swedish Female Poverty Among 25-34 Year Olds
COMPARE
Immigrants from Western Africa
Swedish
Female Poverty Among 25-34 Year Olds
Female Poverty Among 25-34 Year Olds Comparison
Immigrants from Western Africa
Swedes
14.9%
FEMALE POVERTY AMONG 25-34 YEAR OLDS
0.8/ 100
METRIC RATING
248th/ 347
METRIC RANK
12.7%
FEMALE POVERTY AMONG 25-34 YEAR OLDS
95.4/ 100
METRIC RATING
104th/ 347
METRIC RANK
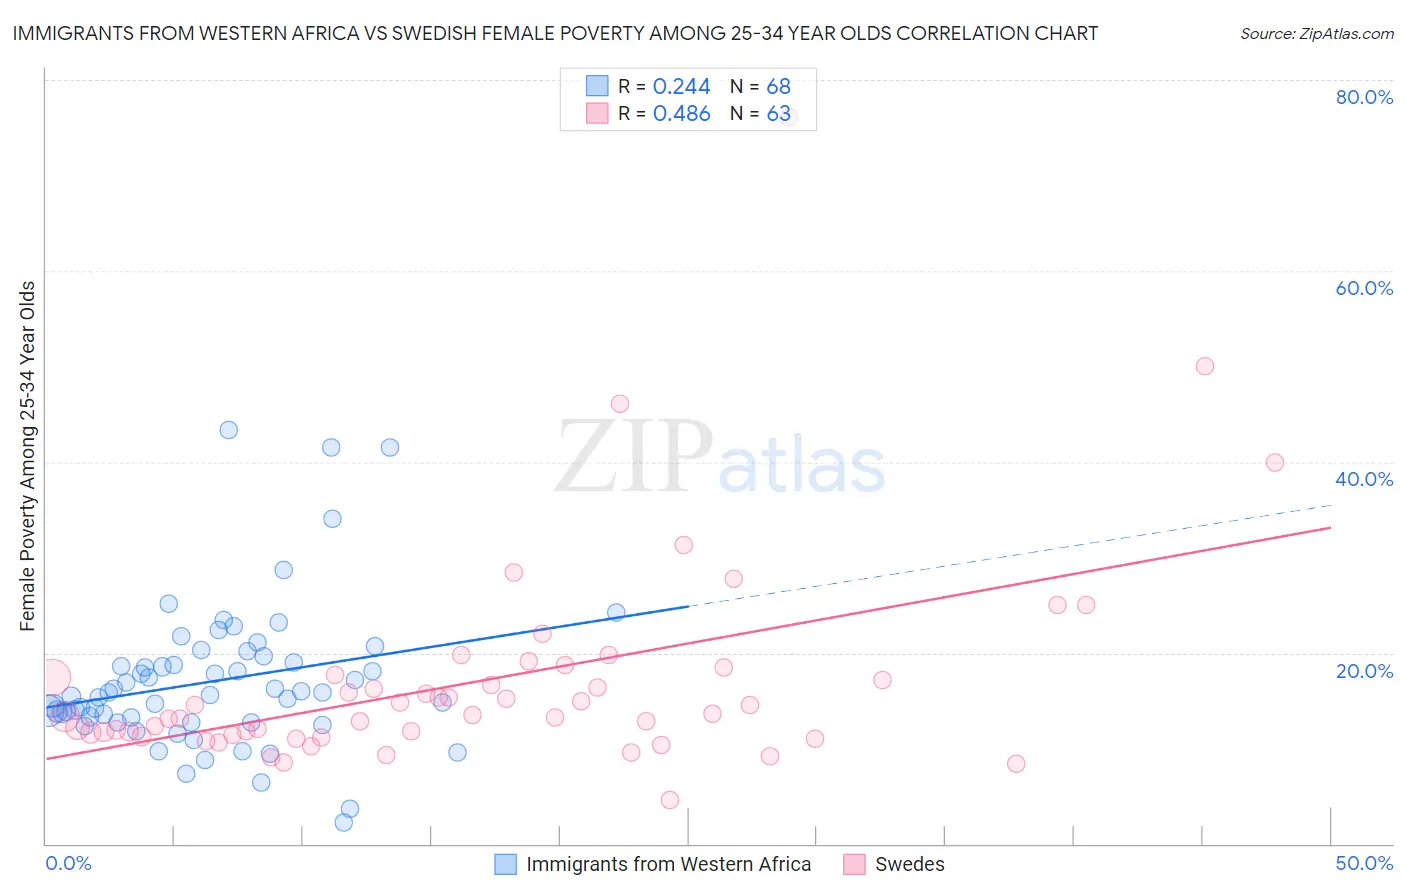
Immigrants from Western Africa vs Swedish Female Poverty Among 25-34 Year Olds Correlation Chart
The statistical analysis conducted on geographies consisting of 353,797,695 people shows a weak positive correlation between the proportion of Immigrants from Western Africa and poverty level among females between the ages 25 and 34 in the United States with a correlation coefficient (R) of 0.244 and weighted average of 14.9%. Similarly, the statistical analysis conducted on geographies consisting of 520,171,676 people shows a moderate positive correlation between the proportion of Swedes and poverty level among females between the ages 25 and 34 in the United States with a correlation coefficient (R) of 0.486 and weighted average of 12.7%, a difference of 17.3%.
Female Poverty Among 25-34 Year Olds Correlation Summary
| Measurement | Immigrants from Western Africa | Swedish |
| Minimum | 2.2% | 4.6% |
| Maximum | 43.3% | 76.1% |
| Range | 41.1% | 71.5% |
| Mean | 17.0% | 17.0% |
| Median | 15.7% | 13.4% |
| Interquartile 25% (IQ1) | 13.0% | 11.3% |
| Interquartile 75% (IQ3) | 19.3% | 17.7% |
| Interquartile Range (IQR) | 6.4% | 6.3% |
| Standard Deviation (Sample) | 7.6% | 11.3% |
| Standard Deviation (Population) | 7.6% | 11.2% |
Similar Demographics by Female Poverty Among 25-34 Year Olds
Demographics Similar to Immigrants from Western Africa by Female Poverty Among 25-34 Year Olds
In terms of female poverty among 25-34 year olds, the demographic groups most similar to Immigrants from Western Africa are German Russian (14.9%, a difference of 0.040%), Jamaican (14.8%, a difference of 0.38%), Immigrants from Middle Africa (14.8%, a difference of 0.42%), Immigrants from Bangladesh (14.8%, a difference of 0.60%), and Immigrants from Nicaragua (14.8%, a difference of 0.61%).
| Demographics | Rating | Rank | Female Poverty Among 25-34 Year Olds |
| Scotch-Irish | 1.2 /100 | #241 | Tragic 14.8% |
| Barbadians | 1.2 /100 | #242 | Tragic 14.8% |
| Immigrants | Nicaragua | 1.1 /100 | #243 | Tragic 14.8% |
| Immigrants | Bangladesh | 1.1 /100 | #244 | Tragic 14.8% |
| Immigrants | Middle Africa | 1.0 /100 | #245 | Tragic 14.8% |
| Jamaicans | 1.0 /100 | #246 | Tragic 14.8% |
| German Russians | 0.8 /100 | #247 | Tragic 14.9% |
| Immigrants | Western Africa | 0.8 /100 | #248 | Tragic 14.9% |
| Immigrants | Haiti | 0.5 /100 | #249 | Tragic 15.0% |
| Immigrants | El Salvador | 0.5 /100 | #250 | Tragic 15.0% |
| Haitians | 0.5 /100 | #251 | Tragic 15.0% |
| Belizeans | 0.4 /100 | #252 | Tragic 15.1% |
| Immigrants | West Indies | 0.4 /100 | #253 | Tragic 15.1% |
| Somalis | 0.4 /100 | #254 | Tragic 15.1% |
| Immigrants | Laos | 0.3 /100 | #255 | Tragic 15.2% |
Demographics Similar to Swedes by Female Poverty Among 25-34 Year Olds
In terms of female poverty among 25-34 year olds, the demographic groups most similar to Swedes are Immigrants from Spain (12.7%, a difference of 0.050%), Immigrants from South Africa (12.7%, a difference of 0.050%), Peruvian (12.7%, a difference of 0.11%), Tsimshian (12.7%, a difference of 0.15%), and Immigrants from Switzerland (12.7%, a difference of 0.17%).
| Demographics | Rating | Rank | Female Poverty Among 25-34 Year Olds |
| Immigrants | Northern Africa | 96.6 /100 | #97 | Exceptional 12.6% |
| Immigrants | Ethiopia | 96.5 /100 | #98 | Exceptional 12.6% |
| Immigrants | Argentina | 96.4 /100 | #99 | Exceptional 12.6% |
| Immigrants | Denmark | 95.7 /100 | #100 | Exceptional 12.7% |
| Immigrants | Switzerland | 95.7 /100 | #101 | Exceptional 12.7% |
| Peruvians | 95.6 /100 | #102 | Exceptional 12.7% |
| Immigrants | Spain | 95.5 /100 | #103 | Exceptional 12.7% |
| Swedes | 95.4 /100 | #104 | Exceptional 12.7% |
| Immigrants | South Africa | 95.3 /100 | #105 | Exceptional 12.7% |
| Tsimshian | 95.1 /100 | #106 | Exceptional 12.7% |
| Poles | 94.9 /100 | #107 | Exceptional 12.7% |
| Immigrants | Norway | 94.4 /100 | #108 | Exceptional 12.7% |
| Immigrants | Peru | 94.3 /100 | #109 | Exceptional 12.7% |
| Australians | 94.1 /100 | #110 | Exceptional 12.8% |
| Danes | 93.9 /100 | #111 | Exceptional 12.8% |