Immigrants from Western Africa vs Pakistani Female Poverty Among 25-34 Year Olds

COMPARE

Immigrants from Western Africa
Race
Ancestry
AfghanAfricanAlaska NativeAlaskan AthabascanAlbanianAleutAlsatianAmericanApacheArabArapahoArgentineanArmenianAssyrian/Chaldean/SyriacAustralianAustrianBahamianBangladeshiBarbadianBasqueBelgianBelizeanBermudanBhutaneseBlackfeetBolivianBrazilianBritishBritish West IndianBulgarianBurmeseCajunCambodianCanadianCape VerdeanCarpatho RusynCelticCentral AmericanCentral American IndianCherokeeCheyenneChickasawChileanChineseChippewaChoctawColombianColvilleComancheCosta RicanCreeCreekCroatianCrowCubanCypriotCzechCzechoslovakianDanishDelawareDominicanDutchDutch West IndianEastern EuropeanEcuadorianEgyptianEnglishEstonianEthiopianEuropeanFijianFilipinoFinnishFrenchFrench American IndianFrench CanadianGermanGerman RussianGhanaianGreekGuamanian/ChamorroGuatemalanGuyaneseHaitianHmongHonduranHopiHoumaHungarianIcelanderIndian (Asian)IndonesianInupiatIranianIraqiIrishIroquoisIsraeliItalianJamaicanJapaneseJordanianKenyanKiowaKoreanLaotianLatvianLebaneseLiberianLithuanianLumbeeLuxembourgerMacedonianMalaysianMalteseMarshalleseMenomineeMexicanMexican American IndianMongolianMoroccanNative HawaiianNavajoNepaleseNew ZealanderNicaraguanNigerianNorthern EuropeanNorwegianOkinawanOsageOttawaPaiutePalestinianPanamanianParaguayanPennsylvania GermanPeruvianPimaPolishPortuguesePotawatomiPuebloPuerto RicanPuget Sound SalishRomanianRussianSalvadoranSamoanScandinavianScotch-IrishScottishSeminoleSenegaleseSerbianShoshoneSierra LeoneanSiouxSlavicSlovakSloveneSomaliSouth AfricanSouth AmericanSouth American IndianSoviet UnionSpaniardSpanishSpanish AmericanSpanish American IndianSri LankanSubsaharan AfricanSudaneseSwedishSwissSyrianTaiwaneseThaiTlingit-HaidaTohono O'OdhamTonganTrinidadian and TobagonianTsimshianTurkishU.S. Virgin IslanderUgandanUkrainianUruguayanUteVenezuelanVietnameseWelshWest IndianYakamaYaquiYugoslavianYumanYup'ikZimbabwean
Immigration
NonimmigrantsImmigrantsAfghanistanAfricaAlbaniaArgentinaArmeniaAsiaAustraliaAustriaBahamasBangladeshBarbadosBelarusBelgiumBelizeBoliviaBosnia and HerzegovinaBrazilBulgariaBurma/MyanmarCabo VerdeCambodiaCameroonCanadaCaribbeanCentral AmericaChileChinaColombiaCongoCosta RicaCroatiaCubaCzechoslovakiaDenmarkDominicaDominican RepublicEastern AfricaEastern AsiaEastern EuropeEcuadorEgyptEl SalvadorEnglandEritreaEthiopiaEuropeFijiFranceGermanyGhanaGreeceGrenadaGuatemalaGuyanaHaitiHondurasHong KongHungaryIndiaIndonesiaIranIraqIrelandIsraelItalyJamaicaJapanJordanKazakhstanKenyaKoreaKuwaitLaosLatin AmericaLatviaLebanonLiberiaLithuaniaMalaysiaMexicoMicronesiaMiddle AfricaMoldovaMoroccoNepalNetherlandsNicaraguaNigeriaNorth AmericaNorth MacedoniaNorthern AfricaNorthern EuropeNorwayOceaniaPakistanPanamaPeruPhilippinesPolandPortugalRomaniaRussiaSaudi ArabiaScotlandSenegalSerbiaSierra LeoneSingaporeSomaliaSouth AfricaSouth AmericaSouth Central AsiaSouth Eastern AsiaSouthern EuropeSpainSri LankaSt. Vincent and the GrenadinesSudanSwedenSwitzerlandSyriaTaiwanThailandTrinidad and TobagoTurkeyUgandaUkraineUruguayUzbekistanVenezuelaVietnamWest IndiesWestern AfricaWestern AsiaWestern EuropeYemenZaireZimbabweAzores
Pakistani
Race
Ancestry
AfghanAfricanAlaska NativeAlaskan AthabascanAlbanianAleutAlsatianAmericanApacheArabArapahoArgentineanArmenianAssyrian/Chaldean/SyriacAustralianAustrianBahamianBangladeshiBarbadianBasqueBelgianBelizeanBermudanBhutaneseBlackfeetBolivianBrazilianBritishBritish West IndianBulgarianBurmeseCajunCambodianCanadianCape VerdeanCarpatho RusynCelticCentral AmericanCentral American IndianCherokeeCheyenneChickasawChileanChineseChippewaChoctawColombianColvilleComancheCosta RicanCreeCreekCroatianCrowCubanCypriotCzechCzechoslovakianDanishDelawareDominicanDutchDutch West IndianEastern EuropeanEcuadorianEgyptianEnglishEstonianEthiopianEuropeanFijianFilipinoFinnishFrenchFrench American IndianFrench CanadianGermanGerman RussianGhanaianGreekGuamanian/ChamorroGuatemalanGuyaneseHaitianHmongHonduranHopiHoumaHungarianIcelanderIndian (Asian)IndonesianInupiatIranianIraqiIrishIroquoisIsraeliItalianJamaicanJapaneseJordanianKenyanKiowaKoreanLaotianLatvianLebaneseLiberianLithuanianLumbeeLuxembourgerMacedonianMalaysianMalteseMarshalleseMenomineeMexicanMexican American IndianMongolianMoroccanNative HawaiianNavajoNepaleseNew ZealanderNicaraguanNigerianNorthern EuropeanNorwegianOkinawanOsageOttawaPaiutePakistaniPalestinianPanamanianParaguayanPennsylvania GermanPeruvianPimaPolishPortuguesePotawatomiPuebloPuerto RicanPuget Sound SalishRomanianRussianSalvadoranSamoanScandinavianScotch-IrishScottishSeminoleSenegaleseSerbianShoshoneSierra LeoneanSiouxSlavicSlovakSloveneSomaliSouth AfricanSouth AmericanSouth American IndianSoviet UnionSpaniardSpanishSpanish AmericanSpanish American IndianSri LankanSubsaharan AfricanSudaneseSwedishSwissSyrianTaiwaneseThaiTlingit-HaidaTohono O'OdhamTonganTrinidadian and TobagonianTsimshianTurkishU.S. Virgin IslanderUgandanUkrainianUruguayanUteVenezuelanVietnameseWelshWest IndianYakamaYaquiYugoslavianYumanYup'ikZimbabwean
Immigration
NonimmigrantsImmigrantsAfghanistanAfricaAlbaniaArgentinaArmeniaAsiaAustraliaAustriaBahamasBangladeshBarbadosBelarusBelgiumBelizeBoliviaBosnia and HerzegovinaBrazilBulgariaBurma/MyanmarCabo VerdeCambodiaCameroonCanadaCaribbeanCentral AmericaChileChinaColombiaCongoCosta RicaCroatiaCubaCzechoslovakiaDenmarkDominicaDominican RepublicEastern AfricaEastern AsiaEastern EuropeEcuadorEgyptEl SalvadorEnglandEritreaEthiopiaEuropeFijiFranceGermanyGhanaGreeceGrenadaGuatemalaGuyanaHaitiHondurasHong KongHungaryIndiaIndonesiaIranIraqIrelandIsraelItalyJamaicaJapanJordanKazakhstanKenyaKoreaKuwaitLaosLatin AmericaLatviaLebanonLiberiaLithuaniaMalaysiaMexicoMicronesiaMiddle AfricaMoldovaMoroccoNepalNetherlandsNicaraguaNigeriaNorth AmericaNorth MacedoniaNorthern AfricaNorthern EuropeNorwayOceaniaPakistanPanamaPeruPhilippinesPolandPortugalRomaniaRussiaSaudi ArabiaScotlandSenegalSerbiaSierra LeoneSingaporeSomaliaSouth AfricaSouth AmericaSouth Central AsiaSouth Eastern AsiaSouthern EuropeSpainSri LankaSt. Vincent and the GrenadinesSudanSwedenSwitzerlandSyriaTaiwanThailandTrinidad and TobagoTurkeyUgandaUkraineUruguayUzbekistanVenezuelaVietnamWest IndiesWestern AsiaWestern EuropeYemenZaireZimbabweAzores
Female Poverty Among 25-34 Year Olds
Income
Poverty
Unemployment
Labor Participation
Family Structure
Vehicle Availability
Education Level
Disability

Female Poverty Among 25-34 Year Olds Comparison

Immigrants from Western Africa

Pakistanis

Tragic
Excellent
14.9%
FEMALE POVERTY AMONG 25-34 YEAR OLDS
0.8/ 100
METRIC RATING
248th/ 347
METRIC RANK
13.0%
FEMALE POVERTY AMONG 25-34 YEAR OLDS
88.4/ 100
METRIC RATING
131st/ 347
METRIC RANK

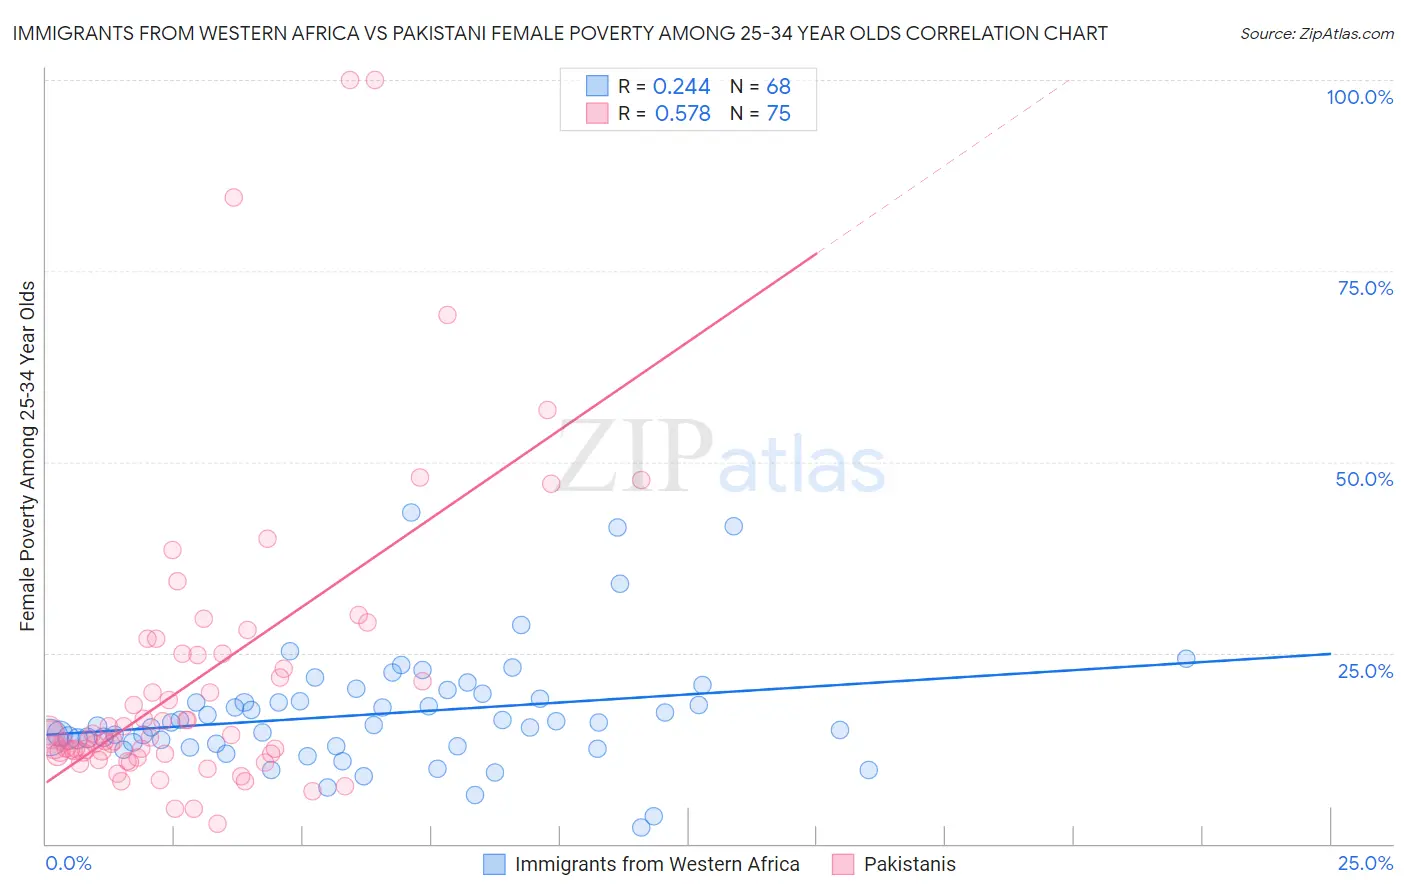
Immigrants from Western Africa vs Pakistani Female Poverty Among 25-34 Year Olds Correlation Chart

The statistical analysis conducted on geographies consisting of 353,797,695 people shows a weak positive correlation between the proportion of Immigrants from Western Africa and poverty level among females between the ages 25 and 34 in the United States with a correlation coefficient (R) of 0.244 and weighted average of 14.9%. Similarly, the statistical analysis conducted on geographies consisting of 332,087,922 people shows a substantial positive correlation between the proportion of Pakistanis and poverty level among females between the ages 25 and 34 in the United States with a correlation coefficient (R) of 0.578 and weighted average of 13.0%, a difference of 14.8%.
Immigrants from Western Africa vs Pakistani Female Poverty Among 25-34 Year Olds

Female Poverty Among 25-34 Year Olds Correlation Summary

MeasurementImmigrants from Western AfricaPakistani
Minimum2.2%2.6%
Maximum43.3%100.0%
Range41.1%97.4%
Mean17.0%21.5%
Median15.7%13.9%
Interquartile 25% (IQ1)13.0%11.8%
Interquartile 75% (IQ3)19.3%24.9%
Interquartile Range (IQR)6.4%13.1%
Standard Deviation (Sample)7.6%19.5%
Standard Deviation (Population)7.6%19.4%

Similar Demographics by Female Poverty Among 25-34 Year Olds

Demographics Similar to Immigrants from Western Africa by Female Poverty Among 25-34 Year Olds

In terms of female poverty among 25-34 year olds, the demographic groups most similar to Immigrants from Western Africa are German Russian (14.9%, a difference of 0.040%), Jamaican (14.8%, a difference of 0.38%), Immigrants from Middle Africa (14.8%, a difference of 0.42%), Immigrants from Bangladesh (14.8%, a difference of 0.60%), and Immigrants from Nicaragua (14.8%, a difference of 0.61%).
DemographicsRating | RankFemale Poverty Among 25-34 Year Olds
Scotch-Irish
1.2
/100
|
#241
Tragic
14.8%
Barbadians
1.2
/100
|
#242
Tragic
14.8%
Immigrants | Nicaragua
1.1
/100
|
#243
Tragic
14.8%
Immigrants | Bangladesh
1.1
/100
|
#244
Tragic
14.8%
Immigrants | Middle Africa
1.0
/100
|
#245
Tragic
14.8%
Jamaicans
1.0
/100
|
#246
Tragic
14.8%
German Russians
0.8
/100
|
#247
Tragic
14.9%
Immigrants | Western Africa
0.8
/100
|
#248
Tragic
14.9%
Immigrants | Haiti
0.5
/100
|
#249
Tragic
15.0%
Immigrants | El Salvador
0.5
/100
|
#250
Tragic
15.0%
Haitians
0.5
/100
|
#251
Tragic
15.0%
Belizeans
0.4
/100
|
#252
Tragic
15.1%
Immigrants | West Indies
0.4
/100
|
#253
Tragic
15.1%
Somalis
0.4
/100
|
#254
Tragic
15.1%
Immigrants | Laos
0.3
/100
|
#255
Tragic
15.2%

Demographics Similar to Pakistanis by Female Poverty Among 25-34 Year Olds

In terms of female poverty among 25-34 year olds, the demographic groups most similar to Pakistanis are Immigrants from Hungary (13.0%, a difference of 0.020%), Serbian (13.0%, a difference of 0.15%), Immigrants from Uzbekistan (12.9%, a difference of 0.27%), Immigrants from North America (12.9%, a difference of 0.30%), and Syrian (12.9%, a difference of 0.42%).
DemographicsRating | RankFemale Poverty Among 25-34 Year Olds
Immigrants | Netherlands
92.0
/100
|
#124
Exceptional
12.8%
Immigrants | Canada
91.5
/100
|
#125
Exceptional
12.9%
Immigrants | Fiji
91.2
/100
|
#126
Exceptional
12.9%
Czechs
90.3
/100
|
#127
Exceptional
12.9%
Syrians
90.2
/100
|
#128
Exceptional
12.9%
Immigrants | North America
89.7
/100
|
#129
Excellent
12.9%
Immigrants | Uzbekistan
89.6
/100
|
#130
Excellent
12.9%
Pakistanis
88.4
/100
|
#131
Excellent
13.0%
Immigrants | Hungary
88.3
/100
|
#132
Excellent
13.0%
Serbians
87.6
/100
|
#133
Excellent
13.0%
Afghans
85.8
/100
|
#134
Excellent
13.0%
South Africans
85.7
/100
|
#135
Excellent
13.0%
Immigrants | England
85.5
/100
|
#136
Excellent
13.0%
Immigrants | Chile
84.6
/100
|
#137
Excellent
13.1%
Brazilians
84.5
/100
|
#138
Excellent
13.1%