Immigrants from Western Africa vs Dutch West Indian Seniors Poverty Over the Age of 75
COMPARE
Immigrants from Western Africa
Dutch West Indian
Seniors Poverty Over the Age of 75
Seniors Poverty Over the Age of 75 Comparison
Immigrants from Western Africa
Dutch West Indians
13.9%
SENIORS POVERTY OVER THE AGE OF 75
0.1/ 100
METRIC RATING
257th/ 347
METRIC RANK
13.5%
SENIORS POVERTY OVER THE AGE OF 75
0.6/ 100
METRIC RATING
243rd/ 347
METRIC RANK
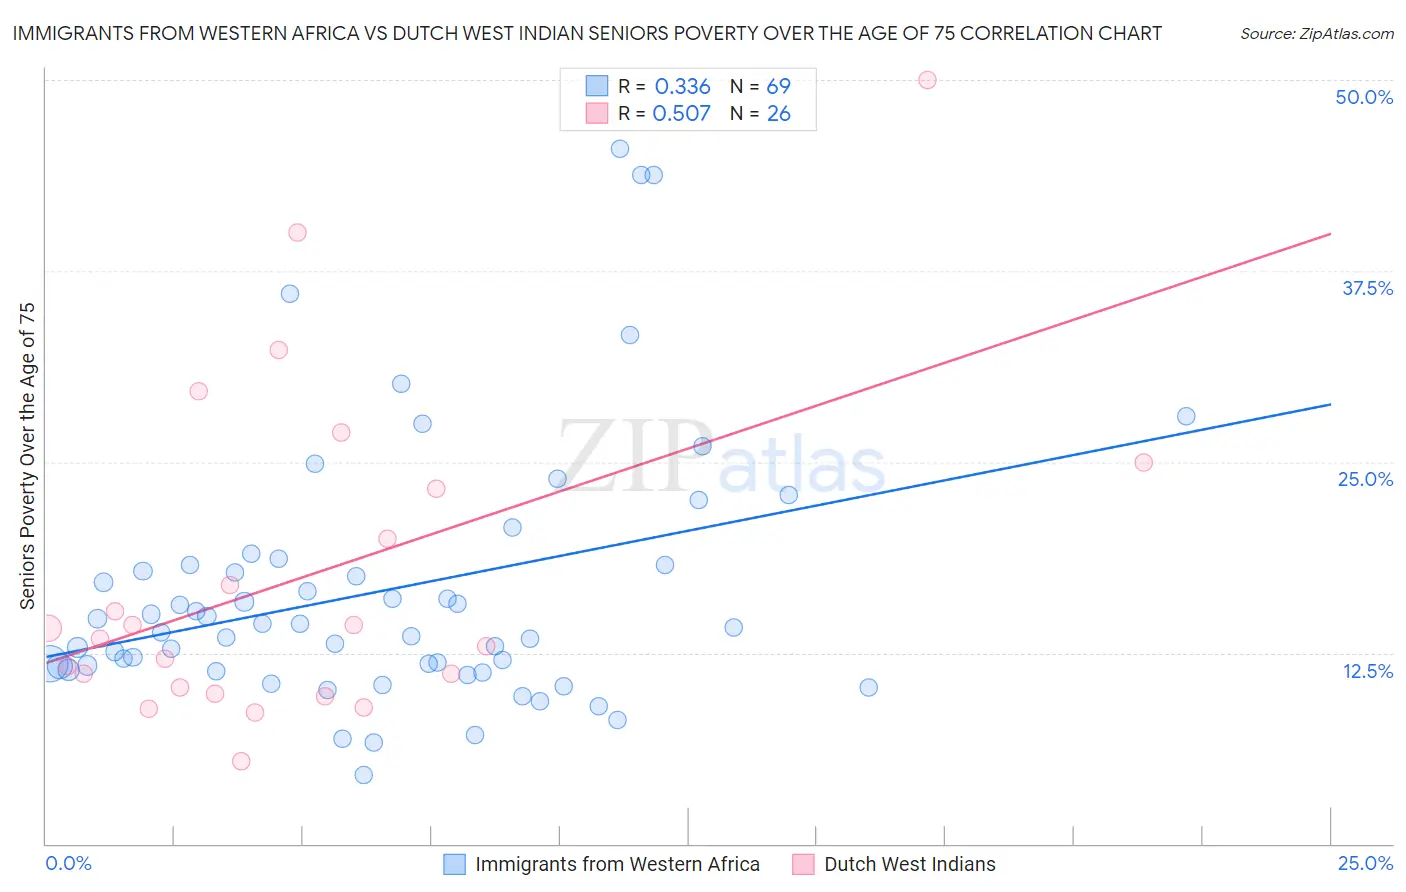
Immigrants from Western Africa vs Dutch West Indian Seniors Poverty Over the Age of 75 Correlation Chart
The statistical analysis conducted on geographies consisting of 353,988,871 people shows a mild positive correlation between the proportion of Immigrants from Western Africa and poverty level among seniors over the age of 75 in the United States with a correlation coefficient (R) of 0.336 and weighted average of 13.9%. Similarly, the statistical analysis conducted on geographies consisting of 85,427,649 people shows a substantial positive correlation between the proportion of Dutch West Indians and poverty level among seniors over the age of 75 in the United States with a correlation coefficient (R) of 0.507 and weighted average of 13.5%, a difference of 3.4%.
Seniors Poverty Over the Age of 75 Correlation Summary
| Measurement | Immigrants from Western Africa | Dutch West Indian |
| Minimum | 4.5% | 5.4% |
| Maximum | 45.5% | 50.0% |
| Range | 41.0% | 44.6% |
| Mean | 16.6% | 17.5% |
| Median | 14.1% | 13.8% |
| Interquartile 25% (IQ1) | 11.5% | 10.2% |
| Interquartile 75% (IQ3) | 18.2% | 23.2% |
| Interquartile Range (IQR) | 6.8% | 13.0% |
| Standard Deviation (Sample) | 8.6% | 10.7% |
| Standard Deviation (Population) | 8.5% | 10.5% |
Demographics Similar to Immigrants from Western Africa and Dutch West Indians by Seniors Poverty Over the Age of 75
In terms of seniors poverty over the age of 75, the demographic groups most similar to Immigrants from Western Africa are Immigrants from Panama (13.9%, a difference of 0.090%), Immigrants from Portugal (13.9%, a difference of 0.13%), Immigrants (13.9%, a difference of 0.20%), Inupiat (13.8%, a difference of 0.58%), and Immigrants from Belarus (13.8%, a difference of 1.1%). Similarly, the demographic groups most similar to Dutch West Indians are Immigrants from Somalia (13.5%, a difference of 0.030%), Immigrants from Russia (13.4%, a difference of 0.12%), Argentinean (13.4%, a difference of 0.26%), Spanish American (13.5%, a difference of 0.32%), and Uruguayan (13.5%, a difference of 0.46%).
| Demographics | Rating | Rank | Seniors Poverty Over the Age of 75 |
| Argentineans | 0.7 /100 | #240 | Tragic 13.4% |
| Immigrants | Russia | 0.6 /100 | #241 | Tragic 13.4% |
| Immigrants | Somalia | 0.6 /100 | #242 | Tragic 13.5% |
| Dutch West Indians | 0.6 /100 | #243 | Tragic 13.5% |
| Spanish Americans | 0.5 /100 | #244 | Tragic 13.5% |
| Uruguayans | 0.5 /100 | #245 | Tragic 13.5% |
| Immigrants | Cambodia | 0.4 /100 | #246 | Tragic 13.6% |
| Immigrants | Ukraine | 0.3 /100 | #247 | Tragic 13.6% |
| Africans | 0.3 /100 | #248 | Tragic 13.6% |
| Immigrants | Albania | 0.3 /100 | #249 | Tragic 13.6% |
| Mexican American Indians | 0.3 /100 | #250 | Tragic 13.6% |
| Immigrants | Peru | 0.3 /100 | #251 | Tragic 13.7% |
| Immigrants | Argentina | 0.3 /100 | #252 | Tragic 13.7% |
| Immigrants | Spain | 0.2 /100 | #253 | Tragic 13.7% |
| Blackfeet | 0.2 /100 | #254 | Tragic 13.7% |
| Immigrants | Belarus | 0.2 /100 | #255 | Tragic 13.8% |
| Inupiat | 0.1 /100 | #256 | Tragic 13.8% |
| Immigrants | Western Africa | 0.1 /100 | #257 | Tragic 13.9% |
| Immigrants | Panama | 0.1 /100 | #258 | Tragic 13.9% |
| Immigrants | Portugal | 0.1 /100 | #259 | Tragic 13.9% |
| Immigrants | Immigrants | 0.1 /100 | #260 | Tragic 13.9% |