Immigrants from Western Africa vs Cape Verdean Seniors Poverty Over the Age of 75
COMPARE
Immigrants from Western Africa
Cape Verdean
Seniors Poverty Over the Age of 75
Seniors Poverty Over the Age of 75 Comparison
Immigrants from Western Africa
Cape Verdeans
13.9%
SENIORS POVERTY OVER THE AGE OF 75
0.1/ 100
METRIC RATING
257th/ 347
METRIC RANK
16.8%
SENIORS POVERTY OVER THE AGE OF 75
0.0/ 100
METRIC RATING
328th/ 347
METRIC RANK
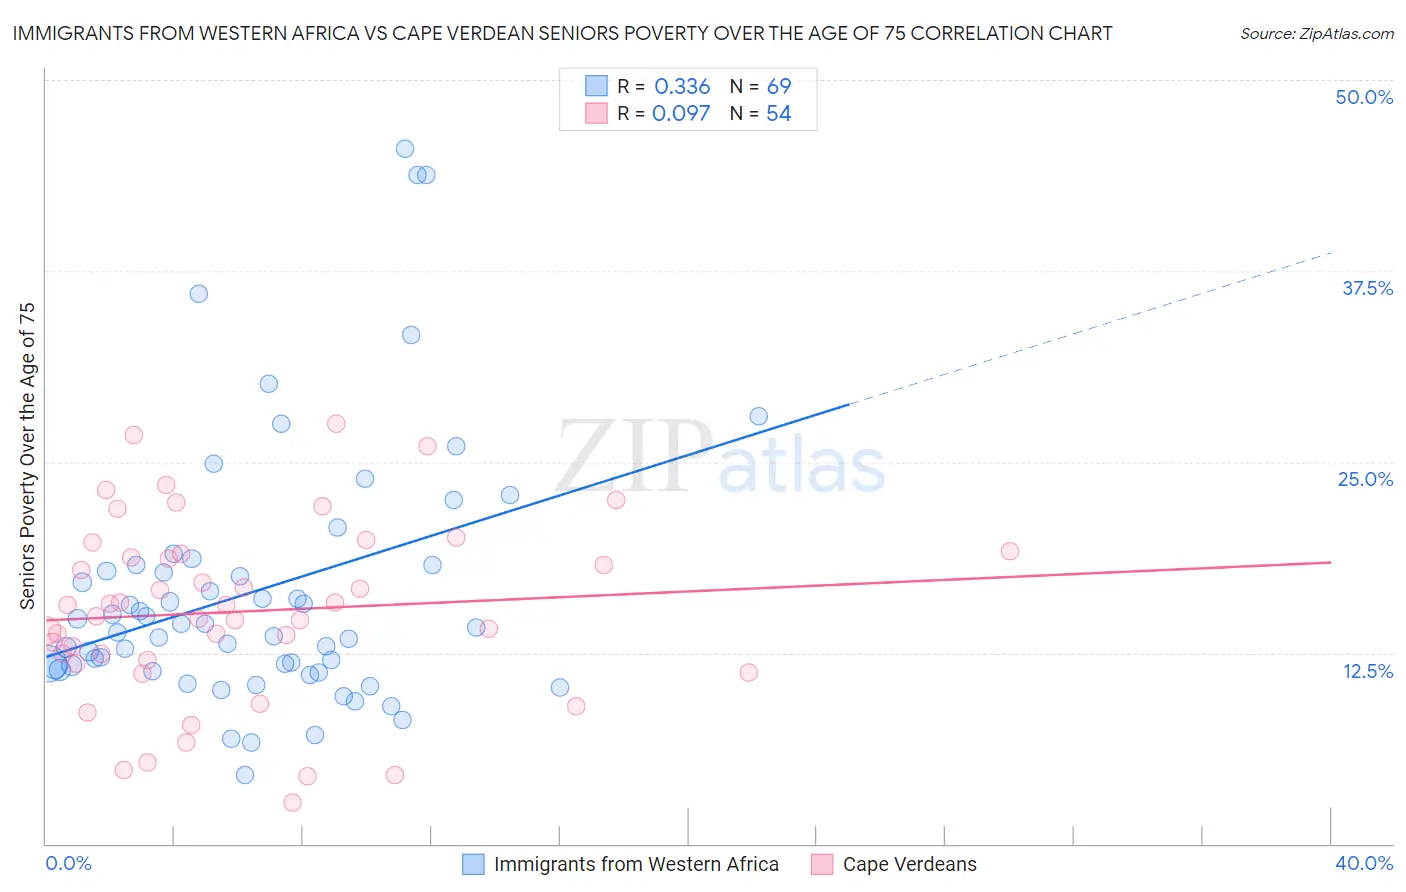
Immigrants from Western Africa vs Cape Verdean Seniors Poverty Over the Age of 75 Correlation Chart
The statistical analysis conducted on geographies consisting of 353,988,871 people shows a mild positive correlation between the proportion of Immigrants from Western Africa and poverty level among seniors over the age of 75 in the United States with a correlation coefficient (R) of 0.336 and weighted average of 13.9%. Similarly, the statistical analysis conducted on geographies consisting of 107,206,089 people shows a slight positive correlation between the proportion of Cape Verdeans and poverty level among seniors over the age of 75 in the United States with a correlation coefficient (R) of 0.097 and weighted average of 16.8%, a difference of 20.5%.
Seniors Poverty Over the Age of 75 Correlation Summary
| Measurement | Immigrants from Western Africa | Cape Verdean |
| Minimum | 4.5% | 2.7% |
| Maximum | 45.5% | 27.5% |
| Range | 41.0% | 24.8% |
| Mean | 16.6% | 15.2% |
| Median | 14.1% | 15.3% |
| Interquartile 25% (IQ1) | 11.5% | 12.0% |
| Interquartile 75% (IQ3) | 18.2% | 19.0% |
| Interquartile Range (IQR) | 6.8% | 7.0% |
| Standard Deviation (Sample) | 8.6% | 5.8% |
| Standard Deviation (Population) | 8.5% | 5.8% |
Similar Demographics by Seniors Poverty Over the Age of 75
Demographics Similar to Immigrants from Western Africa by Seniors Poverty Over the Age of 75
In terms of seniors poverty over the age of 75, the demographic groups most similar to Immigrants from Western Africa are Immigrants from Panama (13.9%, a difference of 0.090%), Immigrants from Portugal (13.9%, a difference of 0.13%), Immigrants (13.9%, a difference of 0.20%), Ghanaian (14.0%, a difference of 0.30%), and Cajun (14.0%, a difference of 0.53%).
| Demographics | Rating | Rank | Seniors Poverty Over the Age of 75 |
| Mexican American Indians | 0.3 /100 | #250 | Tragic 13.6% |
| Immigrants | Peru | 0.3 /100 | #251 | Tragic 13.7% |
| Immigrants | Argentina | 0.3 /100 | #252 | Tragic 13.7% |
| Immigrants | Spain | 0.2 /100 | #253 | Tragic 13.7% |
| Blackfeet | 0.2 /100 | #254 | Tragic 13.7% |
| Immigrants | Belarus | 0.2 /100 | #255 | Tragic 13.8% |
| Inupiat | 0.1 /100 | #256 | Tragic 13.8% |
| Immigrants | Western Africa | 0.1 /100 | #257 | Tragic 13.9% |
| Immigrants | Panama | 0.1 /100 | #258 | Tragic 13.9% |
| Immigrants | Portugal | 0.1 /100 | #259 | Tragic 13.9% |
| Immigrants | Immigrants | 0.1 /100 | #260 | Tragic 13.9% |
| Ghanaians | 0.1 /100 | #261 | Tragic 14.0% |
| Cajuns | 0.1 /100 | #262 | Tragic 14.0% |
| Iroquois | 0.1 /100 | #263 | Tragic 14.0% |
| South Americans | 0.0 /100 | #264 | Tragic 14.1% |
Demographics Similar to Cape Verdeans by Seniors Poverty Over the Age of 75
In terms of seniors poverty over the age of 75, the demographic groups most similar to Cape Verdeans are Sioux (16.8%, a difference of 0.030%), Pueblo (16.7%, a difference of 0.24%), Nicaraguan (16.6%, a difference of 0.94%), Immigrants from Uzbekistan (16.5%, a difference of 1.3%), and Central American Indian (16.5%, a difference of 1.4%).
| Demographics | Rating | Rank | Seniors Poverty Over the Age of 75 |
| Immigrants | Haiti | 0.0 /100 | #321 | Tragic 16.5% |
| Immigrants | Barbados | 0.0 /100 | #322 | Tragic 16.5% |
| Central American Indians | 0.0 /100 | #323 | Tragic 16.5% |
| Immigrants | Uzbekistan | 0.0 /100 | #324 | Tragic 16.5% |
| Nicaraguans | 0.0 /100 | #325 | Tragic 16.6% |
| Pueblo | 0.0 /100 | #326 | Tragic 16.7% |
| Sioux | 0.0 /100 | #327 | Tragic 16.8% |
| Cape Verdeans | 0.0 /100 | #328 | Tragic 16.8% |
| Immigrants | Dominica | 0.0 /100 | #329 | Tragic 17.0% |
| British West Indians | 0.0 /100 | #330 | Tragic 17.4% |
| Immigrants | Armenia | 0.0 /100 | #331 | Tragic 17.5% |
| Immigrants | St. Vincent and the Grenadines | 0.0 /100 | #332 | Tragic 17.5% |
| Immigrants | Nicaragua | 0.0 /100 | #333 | Tragic 17.6% |
| Immigrants | Grenada | 0.0 /100 | #334 | Tragic 17.8% |
| Cubans | 0.0 /100 | #335 | Tragic 18.0% |