Immigrants from Vietnam vs Basque Receiving Food Stamps
COMPARE
Immigrants from Vietnam
Basque
Receiving Food Stamps
Receiving Food Stamps Comparison
Immigrants from Vietnam
Basques
11.0%
RECEIVING FOOD STAMPS
86.7/ 100
METRIC RATING
141st/ 347
METRIC RANK
10.3%
RECEIVING FOOD STAMPS
97.4/ 100
METRIC RATING
95th/ 347
METRIC RANK
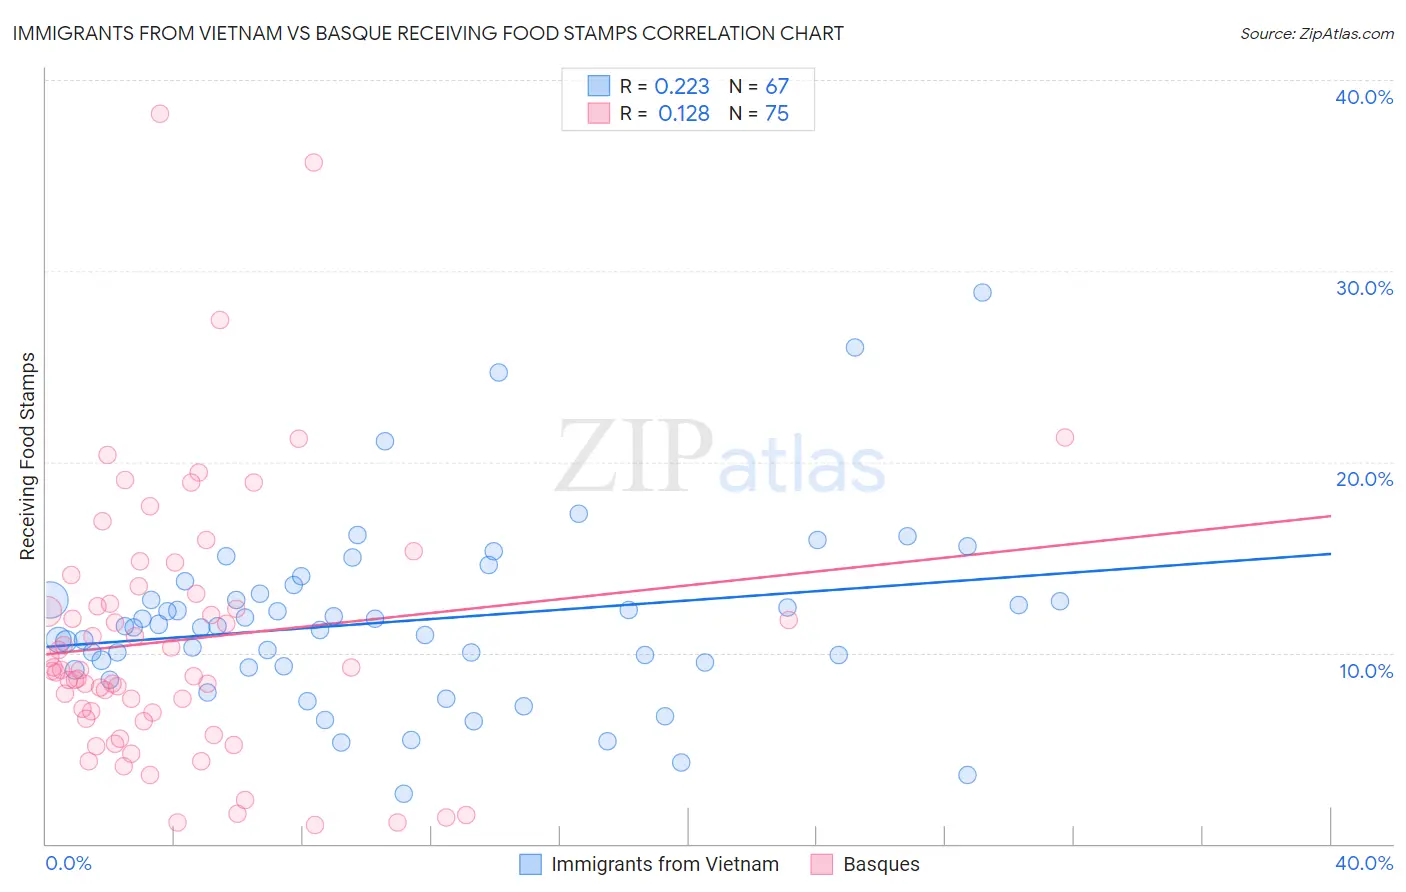
Immigrants from Vietnam vs Basque Receiving Food Stamps Correlation Chart
The statistical analysis conducted on geographies consisting of 403,877,028 people shows a weak positive correlation between the proportion of Immigrants from Vietnam and percentage of population receiving government assistance and/or food stamps in the United States with a correlation coefficient (R) of 0.223 and weighted average of 11.0%. Similarly, the statistical analysis conducted on geographies consisting of 165,638,020 people shows a poor positive correlation between the proportion of Basques and percentage of population receiving government assistance and/or food stamps in the United States with a correlation coefficient (R) of 0.128 and weighted average of 10.3%, a difference of 6.9%.
Receiving Food Stamps Correlation Summary
| Measurement | Immigrants from Vietnam | Basque |
| Minimum | 2.6% | 1.0% |
| Maximum | 28.8% | 38.2% |
| Range | 26.2% | 37.2% |
| Mean | 11.7% | 10.7% |
| Median | 11.4% | 9.1% |
| Interquartile 25% (IQ1) | 9.3% | 6.5% |
| Interquartile 75% (IQ3) | 13.1% | 13.1% |
| Interquartile Range (IQR) | 3.8% | 6.6% |
| Standard Deviation (Sample) | 4.7% | 7.0% |
| Standard Deviation (Population) | 4.7% | 6.9% |
Similar Demographics by Receiving Food Stamps
Demographics Similar to Immigrants from Vietnam by Receiving Food Stamps
In terms of receiving food stamps, the demographic groups most similar to Immigrants from Vietnam are Chilean (11.0%, a difference of 0.17%), Immigrants from Northern Africa (11.0%, a difference of 0.25%), Celtic (10.9%, a difference of 0.36%), Syrian (11.0%, a difference of 0.40%), and Hungarian (11.0%, a difference of 0.51%).
| Demographics | Rating | Rank | Receiving Food Stamps |
| Immigrants | Brazil | 90.3 /100 | #134 | Exceptional 10.8% |
| Argentineans | 90.2 /100 | #135 | Exceptional 10.8% |
| Slovaks | 89.8 /100 | #136 | Excellent 10.8% |
| Immigrants | Eastern Europe | 89.8 /100 | #137 | Excellent 10.8% |
| Immigrants | Moldova | 88.5 /100 | #138 | Excellent 10.9% |
| Hmong | 88.4 /100 | #139 | Excellent 10.9% |
| Celtics | 87.8 /100 | #140 | Excellent 10.9% |
| Immigrants | Vietnam | 86.7 /100 | #141 | Excellent 11.0% |
| Chileans | 86.2 /100 | #142 | Excellent 11.0% |
| Immigrants | Northern Africa | 86.0 /100 | #143 | Excellent 11.0% |
| Syrians | 85.5 /100 | #144 | Excellent 11.0% |
| Hungarians | 85.1 /100 | #145 | Excellent 11.0% |
| Taiwanese | 84.2 /100 | #146 | Excellent 11.0% |
| Whites/Caucasians | 83.9 /100 | #147 | Excellent 11.1% |
| Immigrants | South Eastern Asia | 83.3 /100 | #148 | Excellent 11.1% |
Demographics Similar to Basques by Receiving Food Stamps
In terms of receiving food stamps, the demographic groups most similar to Basques are Immigrants from Greece (10.3%, a difference of 0.030%), Welsh (10.3%, a difference of 0.050%), Czechoslovakian (10.3%, a difference of 0.31%), Immigrants from Egypt (10.3%, a difference of 0.37%), and Serbian (10.3%, a difference of 0.54%).
| Demographics | Rating | Rank | Receiving Food Stamps |
| Immigrants | Kuwait | 98.4 /100 | #88 | Exceptional 10.0% |
| Immigrants | France | 98.3 /100 | #89 | Exceptional 10.1% |
| Finns | 97.9 /100 | #90 | Exceptional 10.2% |
| Jordanians | 97.9 /100 | #91 | Exceptional 10.2% |
| Irish | 97.9 /100 | #92 | Exceptional 10.2% |
| Belgians | 97.7 /100 | #93 | Exceptional 10.2% |
| Immigrants | Greece | 97.4 /100 | #94 | Exceptional 10.3% |
| Basques | 97.4 /100 | #95 | Exceptional 10.3% |
| Welsh | 97.3 /100 | #96 | Exceptional 10.3% |
| Czechoslovakians | 97.2 /100 | #97 | Exceptional 10.3% |
| Immigrants | Egypt | 97.1 /100 | #98 | Exceptional 10.3% |
| Serbians | 97.0 /100 | #99 | Exceptional 10.3% |
| Immigrants | Western Europe | 96.9 /100 | #100 | Exceptional 10.3% |
| Palestinians | 96.9 /100 | #101 | Exceptional 10.3% |
| Immigrants | Europe | 96.8 /100 | #102 | Exceptional 10.3% |