Immigrants from Ukraine vs Indian (Asian) Family Poverty
COMPARE
Immigrants from Ukraine
Indian (Asian)
Family Poverty
Family Poverty Comparison
Immigrants from Ukraine
Indians (Asian)
8.5%
FAMILY POVERTY
83.9/ 100
METRIC RATING
141st/ 347
METRIC RANK
7.7%
FAMILY POVERTY
98.8/ 100
METRIC RATING
52nd/ 347
METRIC RANK
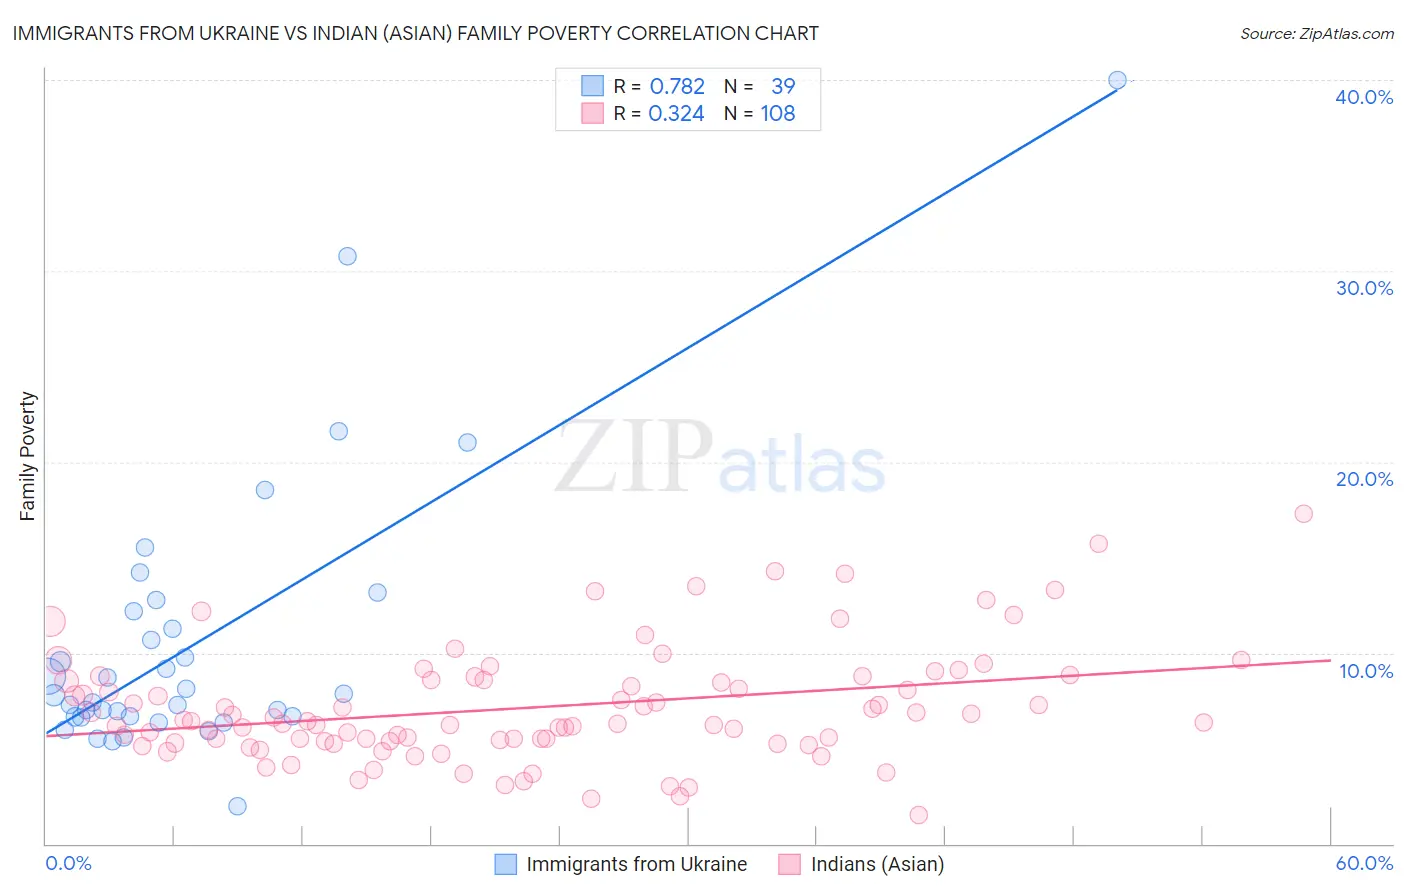
Immigrants from Ukraine vs Indian (Asian) Family Poverty Correlation Chart
The statistical analysis conducted on geographies consisting of 289,107,517 people shows a strong positive correlation between the proportion of Immigrants from Ukraine and poverty level among families in the United States with a correlation coefficient (R) of 0.782 and weighted average of 8.5%. Similarly, the statistical analysis conducted on geographies consisting of 492,769,708 people shows a mild positive correlation between the proportion of Indians (Asian) and poverty level among families in the United States with a correlation coefficient (R) of 0.324 and weighted average of 7.7%, a difference of 10.5%.
Family Poverty Correlation Summary
| Measurement | Immigrants from Ukraine | Indian (Asian) |
| Minimum | 2.0% | 1.5% |
| Maximum | 40.0% | 17.3% |
| Range | 38.0% | 15.8% |
| Mean | 10.5% | 7.1% |
| Median | 7.8% | 6.4% |
| Interquartile 25% (IQ1) | 6.6% | 5.4% |
| Interquartile 75% (IQ3) | 12.2% | 8.6% |
| Interquartile Range (IQR) | 5.5% | 3.2% |
| Standard Deviation (Sample) | 7.3% | 3.0% |
| Standard Deviation (Population) | 7.2% | 2.9% |
Similar Demographics by Family Poverty
Demographics Similar to Immigrants from Ukraine by Family Poverty
In terms of family poverty, the demographic groups most similar to Immigrants from Ukraine are Immigrants from Kazakhstan (8.5%, a difference of 0.030%), Immigrants from Nepal (8.5%, a difference of 0.060%), Yugoslavian (8.5%, a difference of 0.11%), Immigrants from Germany (8.5%, a difference of 0.15%), and Albanian (8.5%, a difference of 0.16%).
| Demographics | Rating | Rank | Family Poverty |
| Chileans | 86.6 /100 | #134 | Excellent 8.5% |
| Immigrants | Malaysia | 86.5 /100 | #135 | Excellent 8.5% |
| Immigrants | Brazil | 86.3 /100 | #136 | Excellent 8.5% |
| Immigrants | Southern Europe | 86.0 /100 | #137 | Excellent 8.5% |
| Armenians | 84.6 /100 | #138 | Excellent 8.5% |
| Immigrants | Nepal | 84.2 /100 | #139 | Excellent 8.5% |
| Immigrants | Kazakhstan | 84.1 /100 | #140 | Excellent 8.5% |
| Immigrants | Ukraine | 83.9 /100 | #141 | Excellent 8.5% |
| Yugoslavians | 83.5 /100 | #142 | Excellent 8.5% |
| Immigrants | Germany | 83.3 /100 | #143 | Excellent 8.5% |
| Albanians | 83.3 /100 | #144 | Excellent 8.5% |
| Immigrants | South Eastern Asia | 83.2 /100 | #145 | Excellent 8.5% |
| Immigrants | Belarus | 83.2 /100 | #146 | Excellent 8.5% |
| Immigrants | Jordan | 83.0 /100 | #147 | Excellent 8.5% |
| Scotch-Irish | 82.2 /100 | #148 | Excellent 8.6% |
Demographics Similar to Indians (Asian) by Family Poverty
In terms of family poverty, the demographic groups most similar to Indians (Asian) are Swiss (7.7%, a difference of 0.060%), Immigrants from Sweden (7.7%, a difference of 0.070%), Immigrants from Eastern Asia (7.7%, a difference of 0.10%), Immigrants from Serbia (7.7%, a difference of 0.14%), and Immigrants from Moldova (7.7%, a difference of 0.16%).
| Demographics | Rating | Rank | Family Poverty |
| Okinawans | 98.9 /100 | #45 | Exceptional 7.7% |
| Tongans | 98.9 /100 | #46 | Exceptional 7.7% |
| Immigrants | Czechoslovakia | 98.9 /100 | #47 | Exceptional 7.7% |
| Immigrants | Sri Lanka | 98.9 /100 | #48 | Exceptional 7.7% |
| Immigrants | Bolivia | 98.9 /100 | #49 | Exceptional 7.7% |
| Immigrants | North Macedonia | 98.9 /100 | #50 | Exceptional 7.7% |
| Immigrants | Moldova | 98.8 /100 | #51 | Exceptional 7.7% |
| Indians (Asian) | 98.8 /100 | #52 | Exceptional 7.7% |
| Swiss | 98.8 /100 | #53 | Exceptional 7.7% |
| Immigrants | Sweden | 98.8 /100 | #54 | Exceptional 7.7% |
| Immigrants | Eastern Asia | 98.7 /100 | #55 | Exceptional 7.7% |
| Immigrants | Serbia | 98.7 /100 | #56 | Exceptional 7.7% |
| Asians | 98.7 /100 | #57 | Exceptional 7.7% |
| Finns | 98.7 /100 | #58 | Exceptional 7.7% |
| Europeans | 98.7 /100 | #59 | Exceptional 7.7% |