Immigrants from Ukraine vs Immigrants from Oceania Child Poverty Under the Age of 16
COMPARE
Immigrants from Ukraine
Immigrants from Oceania
Child Poverty Under the Age of 16
Child Poverty Under the Age of 16 Comparison
Immigrants from Ukraine
Immigrants from Oceania
14.9%
CHILD POVERTY UNDER THE AGE OF 16
93.1/ 100
METRIC RATING
115th/ 347
METRIC RANK
15.9%
CHILD POVERTY UNDER THE AGE OF 16
65.4/ 100
METRIC RATING
166th/ 347
METRIC RANK
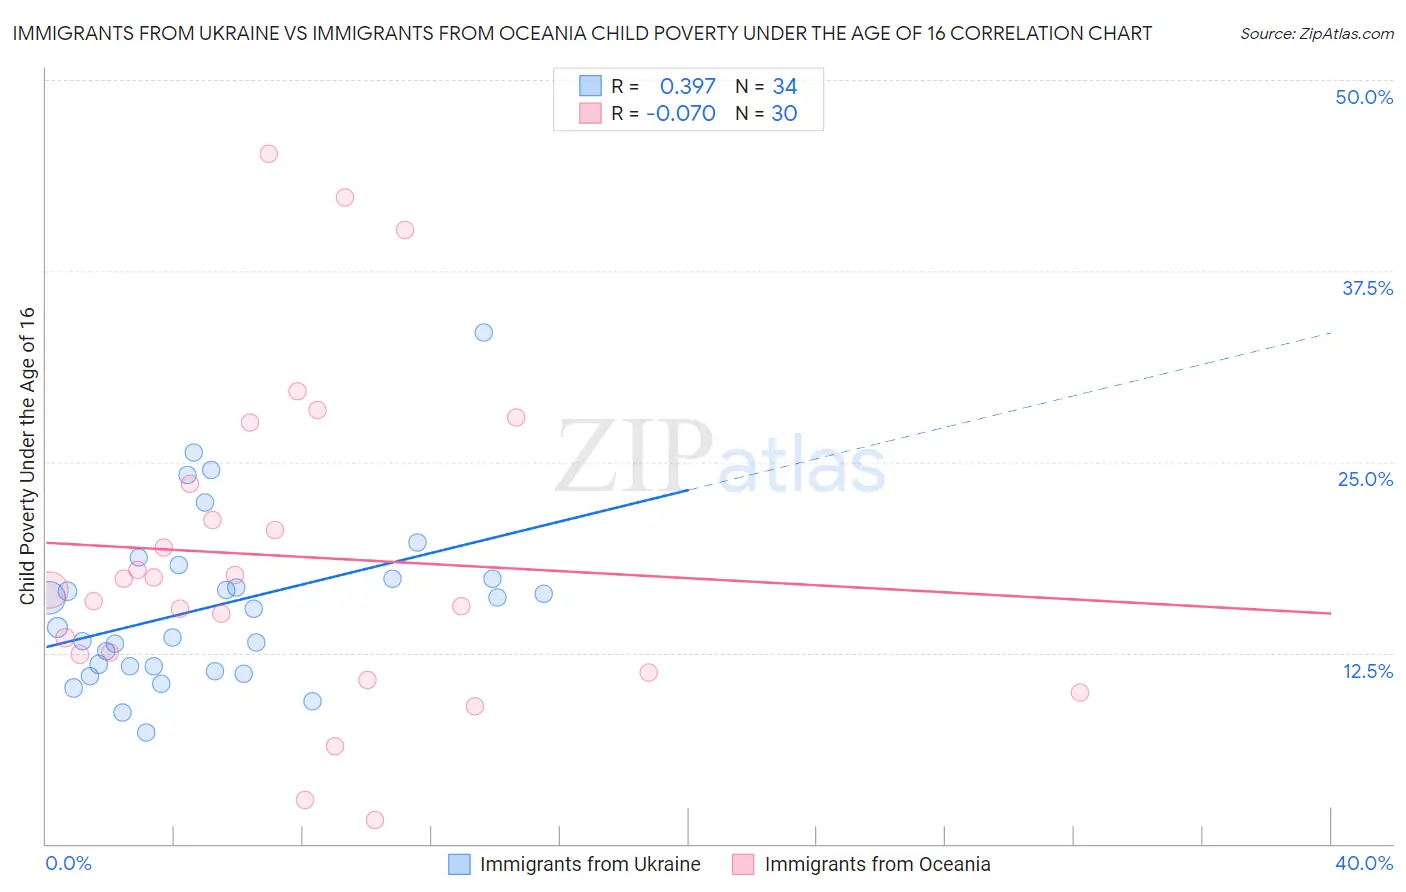
Immigrants from Ukraine vs Immigrants from Oceania Child Poverty Under the Age of 16 Correlation Chart
The statistical analysis conducted on geographies consisting of 287,355,885 people shows a mild positive correlation between the proportion of Immigrants from Ukraine and poverty level among children under the age of 16 in the United States with a correlation coefficient (R) of 0.397 and weighted average of 14.9%. Similarly, the statistical analysis conducted on geographies consisting of 303,303,395 people shows a slight negative correlation between the proportion of Immigrants from Oceania and poverty level among children under the age of 16 in the United States with a correlation coefficient (R) of -0.070 and weighted average of 15.9%, a difference of 6.4%.
Child Poverty Under the Age of 16 Correlation Summary
| Measurement | Immigrants from Ukraine | Immigrants from Oceania |
| Minimum | 7.3% | 1.6% |
| Maximum | 33.5% | 45.2% |
| Range | 26.1% | 43.6% |
| Mean | 15.6% | 18.8% |
| Median | 14.8% | 17.0% |
| Interquartile 25% (IQ1) | 11.6% | 12.4% |
| Interquartile 75% (IQ3) | 17.4% | 23.5% |
| Interquartile Range (IQR) | 5.8% | 11.1% |
| Standard Deviation (Sample) | 5.5% | 10.6% |
| Standard Deviation (Population) | 5.5% | 10.4% |
Similar Demographics by Child Poverty Under the Age of 16
Demographics Similar to Immigrants from Ukraine by Child Poverty Under the Age of 16
In terms of child poverty under the age of 16, the demographic groups most similar to Immigrants from Ukraine are Carpatho Rusyn (14.9%, a difference of 0.020%), Sri Lankan (14.9%, a difference of 0.060%), Belgian (14.9%, a difference of 0.090%), Irish (14.9%, a difference of 0.13%), and Immigrants from Norway (15.0%, a difference of 0.17%).
| Demographics | Rating | Rank | Child Poverty Under the Age of 16 |
| Jordanians | 94.2 /100 | #108 | Exceptional 14.8% |
| Tlingit-Haida | 94.1 /100 | #109 | Exceptional 14.9% |
| English | 93.5 /100 | #110 | Exceptional 14.9% |
| Immigrants | Denmark | 93.5 /100 | #111 | Exceptional 14.9% |
| Irish | 93.4 /100 | #112 | Exceptional 14.9% |
| Belgians | 93.3 /100 | #113 | Exceptional 14.9% |
| Sri Lankans | 93.2 /100 | #114 | Exceptional 14.9% |
| Immigrants | Ukraine | 93.1 /100 | #115 | Exceptional 14.9% |
| Carpatho Rusyns | 93.1 /100 | #116 | Exceptional 14.9% |
| Immigrants | Norway | 92.8 /100 | #117 | Exceptional 15.0% |
| Immigrants | Malaysia | 92.6 /100 | #118 | Exceptional 15.0% |
| Scottish | 92.3 /100 | #119 | Exceptional 15.0% |
| South Africans | 92.1 /100 | #120 | Exceptional 15.0% |
| Immigrants | Zimbabwe | 92.1 /100 | #121 | Exceptional 15.0% |
| Pakistanis | 91.7 /100 | #122 | Exceptional 15.0% |
Demographics Similar to Immigrants from Oceania by Child Poverty Under the Age of 16
In terms of child poverty under the age of 16, the demographic groups most similar to Immigrants from Oceania are Guamanian/Chamorro (15.9%, a difference of 0.13%), Immigrants from Germany (15.8%, a difference of 0.27%), Colombian (15.8%, a difference of 0.30%), Yugoslavian (15.8%, a difference of 0.30%), and Immigrants from Northern Africa (15.8%, a difference of 0.37%).
| Demographics | Rating | Rank | Child Poverty Under the Age of 16 |
| Immigrants | Fiji | 71.1 /100 | #159 | Good 15.8% |
| Immigrants | Albania | 70.7 /100 | #160 | Good 15.8% |
| Immigrants | Northern Africa | 68.1 /100 | #161 | Good 15.8% |
| Colombians | 67.6 /100 | #162 | Good 15.8% |
| Yugoslavians | 67.6 /100 | #163 | Good 15.8% |
| Immigrants | Germany | 67.3 /100 | #164 | Good 15.8% |
| Guamanians/Chamorros | 66.4 /100 | #165 | Good 15.9% |
| Immigrants | Oceania | 65.4 /100 | #166 | Good 15.9% |
| Costa Ricans | 61.1 /100 | #167 | Good 16.0% |
| South Americans | 57.9 /100 | #168 | Average 16.0% |
| Uruguayans | 54.7 /100 | #169 | Average 16.1% |
| Immigrants | Colombia | 54.4 /100 | #170 | Average 16.1% |
| Hungarians | 52.5 /100 | #171 | Average 16.2% |
| Afghans | 52.3 /100 | #172 | Average 16.2% |
| Immigrants | Saudi Arabia | 52.1 /100 | #173 | Average 16.2% |