Immigrants from Turkey vs Pakistani Child Poverty Under the Age of 5
COMPARE
Immigrants from Turkey
Pakistani
Child Poverty Under the Age of 5
Child Poverty Under the Age of 5 Comparison
Immigrants from Turkey
Pakistanis
15.4%
CHILD POVERTY UNDER THE AGE OF 5
98.3/ 100
METRIC RATING
77th/ 347
METRIC RANK
16.0%
CHILD POVERTY UNDER THE AGE OF 5
94.2/ 100
METRIC RATING
111th/ 347
METRIC RANK
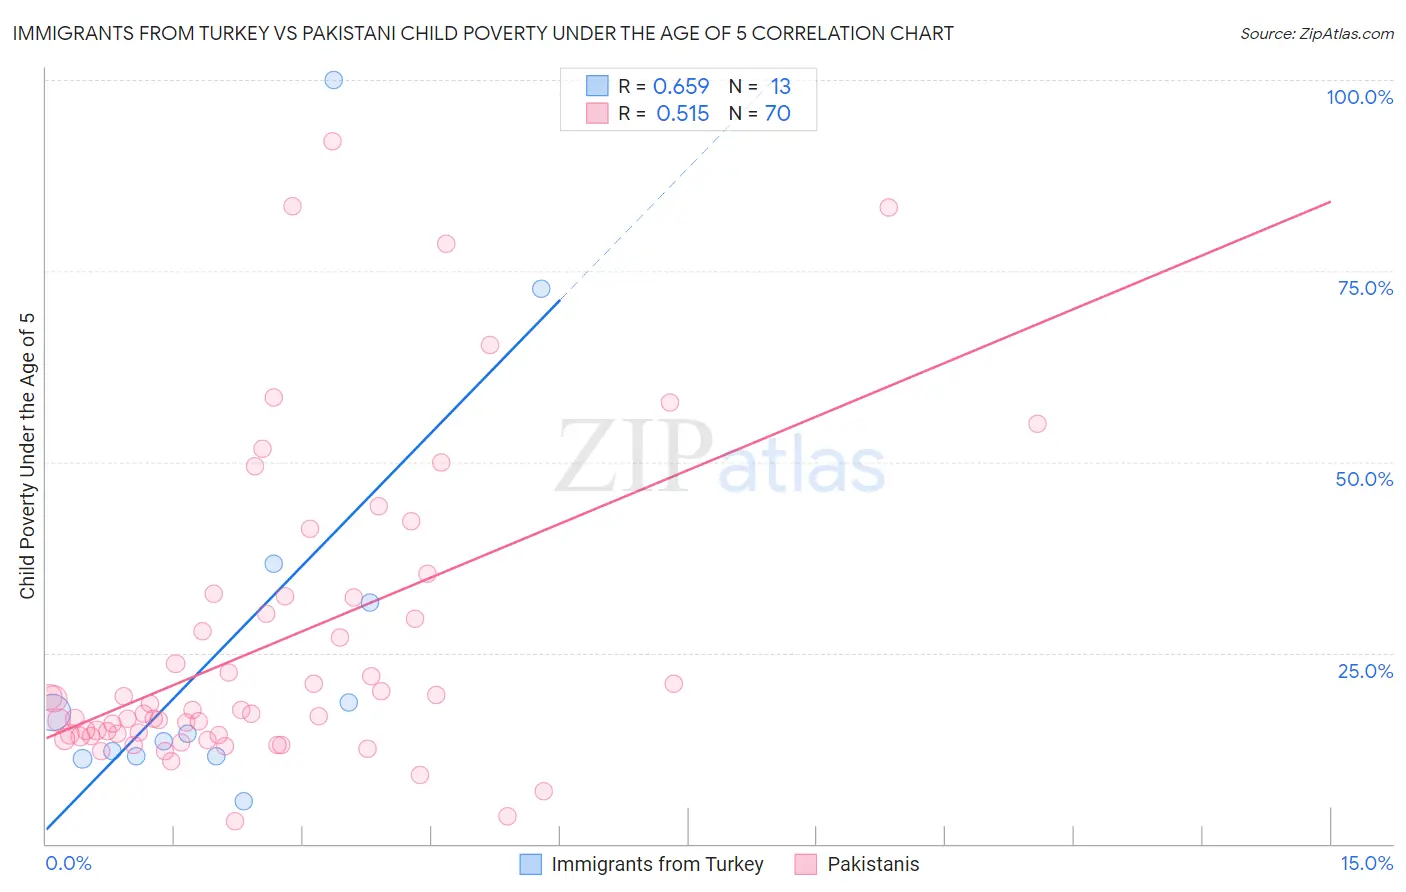
Immigrants from Turkey vs Pakistani Child Poverty Under the Age of 5 Correlation Chart
The statistical analysis conducted on geographies consisting of 215,409,827 people shows a significant positive correlation between the proportion of Immigrants from Turkey and poverty level among children under the age of 5 in the United States with a correlation coefficient (R) of 0.659 and weighted average of 15.4%. Similarly, the statistical analysis conducted on geographies consisting of 324,820,623 people shows a substantial positive correlation between the proportion of Pakistanis and poverty level among children under the age of 5 in the United States with a correlation coefficient (R) of 0.515 and weighted average of 16.0%, a difference of 3.8%.
Child Poverty Under the Age of 5 Correlation Summary
| Measurement | Immigrants from Turkey | Pakistani |
| Minimum | 5.6% | 3.0% |
| Maximum | 100.0% | 92.0% |
| Range | 94.4% | 89.0% |
| Mean | 27.4% | 26.2% |
| Median | 14.4% | 17.3% |
| Interquartile 25% (IQ1) | 11.5% | 14.3% |
| Interquartile 75% (IQ3) | 34.1% | 32.3% |
| Interquartile Range (IQR) | 22.7% | 18.0% |
| Standard Deviation (Sample) | 28.1% | 19.9% |
| Standard Deviation (Population) | 27.0% | 19.8% |
Similar Demographics by Child Poverty Under the Age of 5
Demographics Similar to Immigrants from Turkey by Child Poverty Under the Age of 5
In terms of child poverty under the age of 5, the demographic groups most similar to Immigrants from Turkey are Immigrants from Argentina (15.4%, a difference of 0.21%), Croatian (15.4%, a difference of 0.21%), Sri Lankan (15.5%, a difference of 0.33%), Argentinean (15.4%, a difference of 0.36%), and Australian (15.5%, a difference of 0.58%).
| Demographics | Rating | Rank | Child Poverty Under the Age of 5 |
| Immigrants | Belgium | 98.8 /100 | #70 | Exceptional 15.3% |
| Immigrants | Egypt | 98.8 /100 | #71 | Exceptional 15.3% |
| Immigrants | Sweden | 98.8 /100 | #72 | Exceptional 15.3% |
| Immigrants | Ukraine | 98.7 /100 | #73 | Exceptional 15.3% |
| Argentineans | 98.5 /100 | #74 | Exceptional 15.4% |
| Immigrants | Argentina | 98.5 /100 | #75 | Exceptional 15.4% |
| Croatians | 98.5 /100 | #76 | Exceptional 15.4% |
| Immigrants | Turkey | 98.3 /100 | #77 | Exceptional 15.4% |
| Sri Lankans | 98.1 /100 | #78 | Exceptional 15.5% |
| Australians | 98.0 /100 | #79 | Exceptional 15.5% |
| Italians | 97.9 /100 | #80 | Exceptional 15.5% |
| Czechs | 97.8 /100 | #81 | Exceptional 15.5% |
| Immigrants | Italy | 97.7 /100 | #82 | Exceptional 15.6% |
| Chileans | 97.6 /100 | #83 | Exceptional 15.6% |
| Immigrants | Netherlands | 97.6 /100 | #84 | Exceptional 15.6% |
Demographics Similar to Pakistanis by Child Poverty Under the Age of 5
In terms of child poverty under the age of 5, the demographic groups most similar to Pakistanis are Northern European (16.0%, a difference of 0.040%), Romanian (16.0%, a difference of 0.040%), Peruvian (16.0%, a difference of 0.050%), Puget Sound Salish (16.0%, a difference of 0.060%), and Immigrants from Brazil (16.0%, a difference of 0.12%).
| Demographics | Rating | Rank | Child Poverty Under the Age of 5 |
| Immigrants | North America | 94.9 /100 | #104 | Exceptional 15.9% |
| Immigrants | Spain | 94.8 /100 | #105 | Exceptional 15.9% |
| Tlingit-Haida | 94.7 /100 | #106 | Exceptional 15.9% |
| Slovenes | 94.4 /100 | #107 | Exceptional 16.0% |
| Immigrants | Brazil | 94.4 /100 | #108 | Exceptional 16.0% |
| Northern Europeans | 94.3 /100 | #109 | Exceptional 16.0% |
| Romanians | 94.3 /100 | #110 | Exceptional 16.0% |
| Pakistanis | 94.2 /100 | #111 | Exceptional 16.0% |
| Peruvians | 94.1 /100 | #112 | Exceptional 16.0% |
| Puget Sound Salish | 94.1 /100 | #113 | Exceptional 16.0% |
| Immigrants | Kuwait | 93.9 /100 | #114 | Exceptional 16.0% |
| Albanians | 93.8 /100 | #115 | Exceptional 16.0% |
| Immigrants | Austria | 93.5 /100 | #116 | Exceptional 16.0% |
| Basques | 93.4 /100 | #117 | Exceptional 16.0% |
| Immigrants | Denmark | 93.4 /100 | #118 | Exceptional 16.0% |