Immigrants from Turkey vs Immigrants from Belgium Receiving Food Stamps
COMPARE
Immigrants from Turkey
Immigrants from Belgium
Receiving Food Stamps
Receiving Food Stamps Comparison
Immigrants from Turkey
Immigrants from Belgium
9.8%
RECEIVING FOOD STAMPS
99.1/ 100
METRIC RATING
65th/ 347
METRIC RANK
9.6%
RECEIVING FOOD STAMPS
99.4/ 100
METRIC RATING
45th/ 347
METRIC RANK
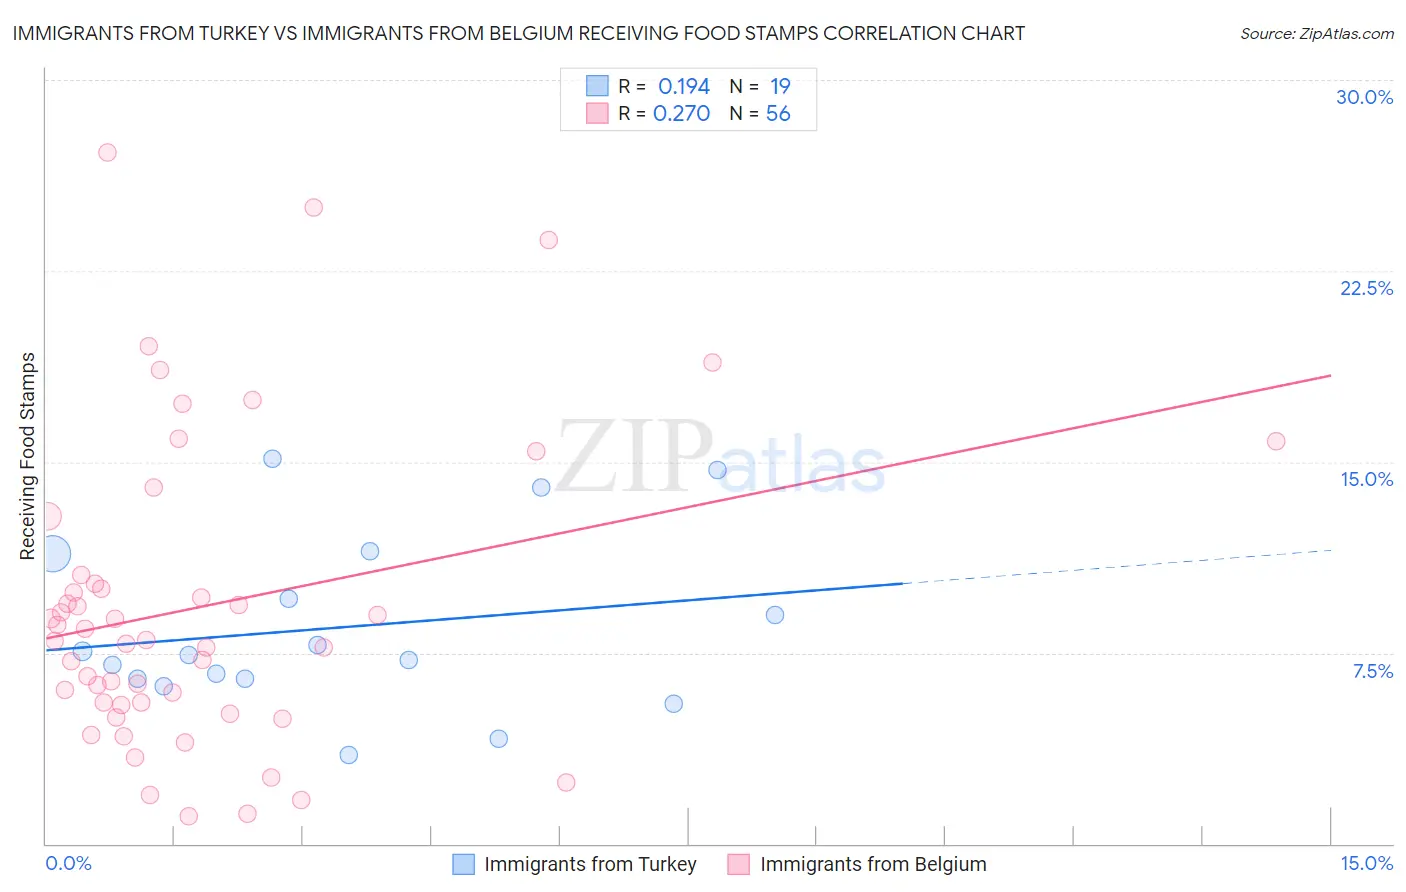
Immigrants from Turkey vs Immigrants from Belgium Receiving Food Stamps Correlation Chart
The statistical analysis conducted on geographies consisting of 222,535,974 people shows a poor positive correlation between the proportion of Immigrants from Turkey and percentage of population receiving government assistance and/or food stamps in the United States with a correlation coefficient (R) of 0.194 and weighted average of 9.8%. Similarly, the statistical analysis conducted on geographies consisting of 146,482,821 people shows a weak positive correlation between the proportion of Immigrants from Belgium and percentage of population receiving government assistance and/or food stamps in the United States with a correlation coefficient (R) of 0.270 and weighted average of 9.6%, a difference of 1.9%.
Receiving Food Stamps Correlation Summary
| Measurement | Immigrants from Turkey | Immigrants from Belgium |
| Minimum | 3.5% | 1.1% |
| Maximum | 15.1% | 27.1% |
| Range | 11.7% | 26.0% |
| Mean | 8.5% | 9.3% |
| Median | 7.4% | 8.0% |
| Interquartile 25% (IQ1) | 6.5% | 5.5% |
| Interquartile 75% (IQ3) | 11.4% | 10.4% |
| Interquartile Range (IQR) | 4.9% | 4.9% |
| Standard Deviation (Sample) | 3.4% | 6.0% |
| Standard Deviation (Population) | 3.3% | 5.9% |
Demographics Similar to Immigrants from Turkey and Immigrants from Belgium by Receiving Food Stamps
In terms of receiving food stamps, the demographic groups most similar to Immigrants from Turkey are Immigrants from North America (9.8%, a difference of 0.17%), Chinese (9.8%, a difference of 0.26%), Immigrants from Bulgaria (9.8%, a difference of 0.28%), English (9.8%, a difference of 0.36%), and German (9.7%, a difference of 0.50%). Similarly, the demographic groups most similar to Immigrants from Belgium are Australian (9.6%, a difference of 0.080%), Indian (Asian) (9.6%, a difference of 0.15%), Russian (9.6%, a difference of 0.25%), Immigrants from Czechoslovakia (9.6%, a difference of 0.27%), and Lithuanian (9.7%, a difference of 0.52%).
| Demographics | Rating | Rank | Receiving Food Stamps |
| Immigrants | Belgium | 99.4 /100 | #45 | Exceptional 9.6% |
| Australians | 99.4 /100 | #46 | Exceptional 9.6% |
| Indians (Asian) | 99.4 /100 | #47 | Exceptional 9.6% |
| Russians | 99.4 /100 | #48 | Exceptional 9.6% |
| Immigrants | Czechoslovakia | 99.4 /100 | #49 | Exceptional 9.6% |
| Lithuanians | 99.4 /100 | #50 | Exceptional 9.7% |
| Asians | 99.3 /100 | #51 | Exceptional 9.7% |
| Immigrants | South Africa | 99.3 /100 | #52 | Exceptional 9.7% |
| Tongans | 99.3 /100 | #53 | Exceptional 9.7% |
| Swiss | 99.3 /100 | #54 | Exceptional 9.7% |
| Immigrants | Switzerland | 99.3 /100 | #55 | Exceptional 9.7% |
| Immigrants | Canada | 99.3 /100 | #56 | Exceptional 9.7% |
| Greeks | 99.3 /100 | #57 | Exceptional 9.7% |
| Scandinavians | 99.2 /100 | #58 | Exceptional 9.7% |
| British | 99.2 /100 | #59 | Exceptional 9.7% |
| Germans | 99.2 /100 | #60 | Exceptional 9.7% |
| English | 99.2 /100 | #61 | Exceptional 9.8% |
| Immigrants | Bulgaria | 99.2 /100 | #62 | Exceptional 9.8% |
| Chinese | 99.2 /100 | #63 | Exceptional 9.8% |
| Immigrants | North America | 99.2 /100 | #64 | Exceptional 9.8% |
| Immigrants | Turkey | 99.1 /100 | #65 | Exceptional 9.8% |