Immigrants from Taiwan vs Immigrants from Southern Europe Single Male Poverty
COMPARE
Immigrants from Taiwan
Immigrants from Southern Europe
Single Male Poverty
Single Male Poverty Comparison
Immigrants from Taiwan
Immigrants from Southern Europe
10.3%
SINGLE MALE POVERTY
100.0/ 100
METRIC RATING
2nd/ 347
METRIC RANK
12.4%
SINGLE MALE POVERTY
91.5/ 100
METRIC RATING
115th/ 347
METRIC RANK
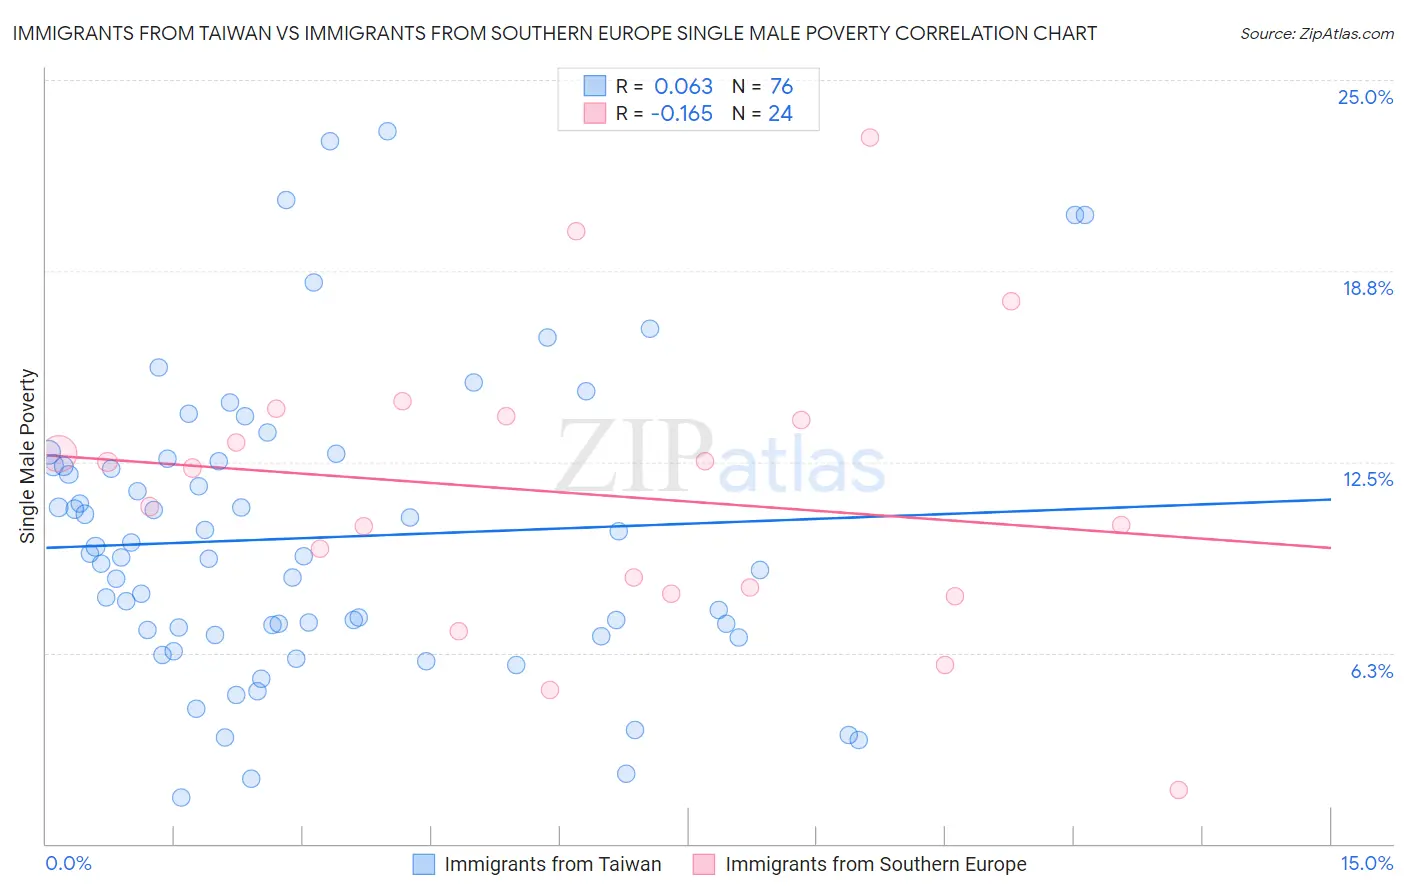
Immigrants from Taiwan vs Immigrants from Southern Europe Single Male Poverty Correlation Chart
The statistical analysis conducted on geographies consisting of 266,940,176 people shows a slight positive correlation between the proportion of Immigrants from Taiwan and poverty level among single males in the United States with a correlation coefficient (R) of 0.063 and weighted average of 10.3%. Similarly, the statistical analysis conducted on geographies consisting of 351,913,565 people shows a poor negative correlation between the proportion of Immigrants from Southern Europe and poverty level among single males in the United States with a correlation coefficient (R) of -0.165 and weighted average of 12.4%, a difference of 20.6%.
Single Male Poverty Correlation Summary
| Measurement | Immigrants from Taiwan | Immigrants from Southern Europe |
| Minimum | 1.5% | 1.7% |
| Maximum | 23.3% | 23.1% |
| Range | 21.8% | 21.4% |
| Mean | 10.0% | 11.5% |
| Median | 9.4% | 11.7% |
| Interquartile 25% (IQ1) | 6.9% | 8.3% |
| Interquartile 75% (IQ3) | 12.5% | 13.9% |
| Interquartile Range (IQR) | 5.5% | 5.7% |
| Standard Deviation (Sample) | 4.8% | 4.7% |
| Standard Deviation (Population) | 4.8% | 4.6% |
Similar Demographics by Single Male Poverty
Demographics Similar to Immigrants from Taiwan by Single Male Poverty
In terms of single male poverty, the demographic groups most similar to Immigrants from Taiwan are Immigrants from India (10.3%, a difference of 0.67%), Immigrants from Hong Kong (10.4%, a difference of 1.7%), Tongan (10.5%, a difference of 1.7%), Filipino (10.6%, a difference of 3.4%), and Afghan (10.7%, a difference of 4.2%).
| Demographics | Rating | Rank | Single Male Poverty |
| Assyrians/Chaldeans/Syriacs | 100.0 /100 | #1 | Exceptional 9.8% |
| Immigrants | Taiwan | 100.0 /100 | #2 | Exceptional 10.3% |
| Immigrants | India | 100.0 /100 | #3 | Exceptional 10.3% |
| Immigrants | Hong Kong | 100.0 /100 | #4 | Exceptional 10.4% |
| Tongans | 100.0 /100 | #5 | Exceptional 10.5% |
| Filipinos | 100.0 /100 | #6 | Exceptional 10.6% |
| Afghans | 100.0 /100 | #7 | Exceptional 10.7% |
| Thais | 100.0 /100 | #8 | Exceptional 10.8% |
| Taiwanese | 100.0 /100 | #9 | Exceptional 10.9% |
| Immigrants | Fiji | 100.0 /100 | #10 | Exceptional 10.9% |
| Immigrants | Philippines | 100.0 /100 | #11 | Exceptional 10.9% |
| Immigrants | Afghanistan | 100.0 /100 | #12 | Exceptional 10.9% |
| Immigrants | South Central Asia | 100.0 /100 | #13 | Exceptional 10.9% |
| Chinese | 100.0 /100 | #14 | Exceptional 11.0% |
| Koreans | 100.0 /100 | #15 | Exceptional 11.0% |
Demographics Similar to Immigrants from Southern Europe by Single Male Poverty
In terms of single male poverty, the demographic groups most similar to Immigrants from Southern Europe are Immigrants from Syria (12.4%, a difference of 0.060%), Immigrants from Oceania (12.4%, a difference of 0.070%), Nicaraguan (12.4%, a difference of 0.11%), Pakistani (12.4%, a difference of 0.15%), and Albanian (12.4%, a difference of 0.16%).
| Demographics | Rating | Rank | Single Male Poverty |
| Immigrants | Eastern Africa | 95.0 /100 | #108 | Exceptional 12.3% |
| Ugandans | 94.5 /100 | #109 | Exceptional 12.3% |
| Immigrants | Portugal | 93.6 /100 | #110 | Exceptional 12.3% |
| Immigrants | North Macedonia | 93.6 /100 | #111 | Exceptional 12.3% |
| Kenyans | 93.3 /100 | #112 | Exceptional 12.4% |
| Pakistanis | 92.4 /100 | #113 | Exceptional 12.4% |
| Nicaraguans | 92.1 /100 | #114 | Exceptional 12.4% |
| Immigrants | Southern Europe | 91.5 /100 | #115 | Exceptional 12.4% |
| Immigrants | Syria | 91.2 /100 | #116 | Exceptional 12.4% |
| Immigrants | Oceania | 91.1 /100 | #117 | Exceptional 12.4% |
| Albanians | 90.6 /100 | #118 | Exceptional 12.4% |
| Immigrants | Albania | 90.3 /100 | #119 | Exceptional 12.4% |
| Venezuelans | 89.4 /100 | #120 | Excellent 12.4% |
| Icelanders | 88.2 /100 | #121 | Excellent 12.5% |
| Serbians | 87.9 /100 | #122 | Excellent 12.5% |