Immigrants from South Eastern Asia vs Nigerian Poverty
COMPARE
Immigrants from South Eastern Asia
Nigerian
Poverty
Poverty Comparison
Immigrants from South Eastern Asia
Nigerians
11.7%
POVERTY
88.9/ 100
METRIC RATING
120th/ 347
METRIC RANK
13.6%
POVERTY
1.4/ 100
METRIC RATING
231st/ 347
METRIC RANK
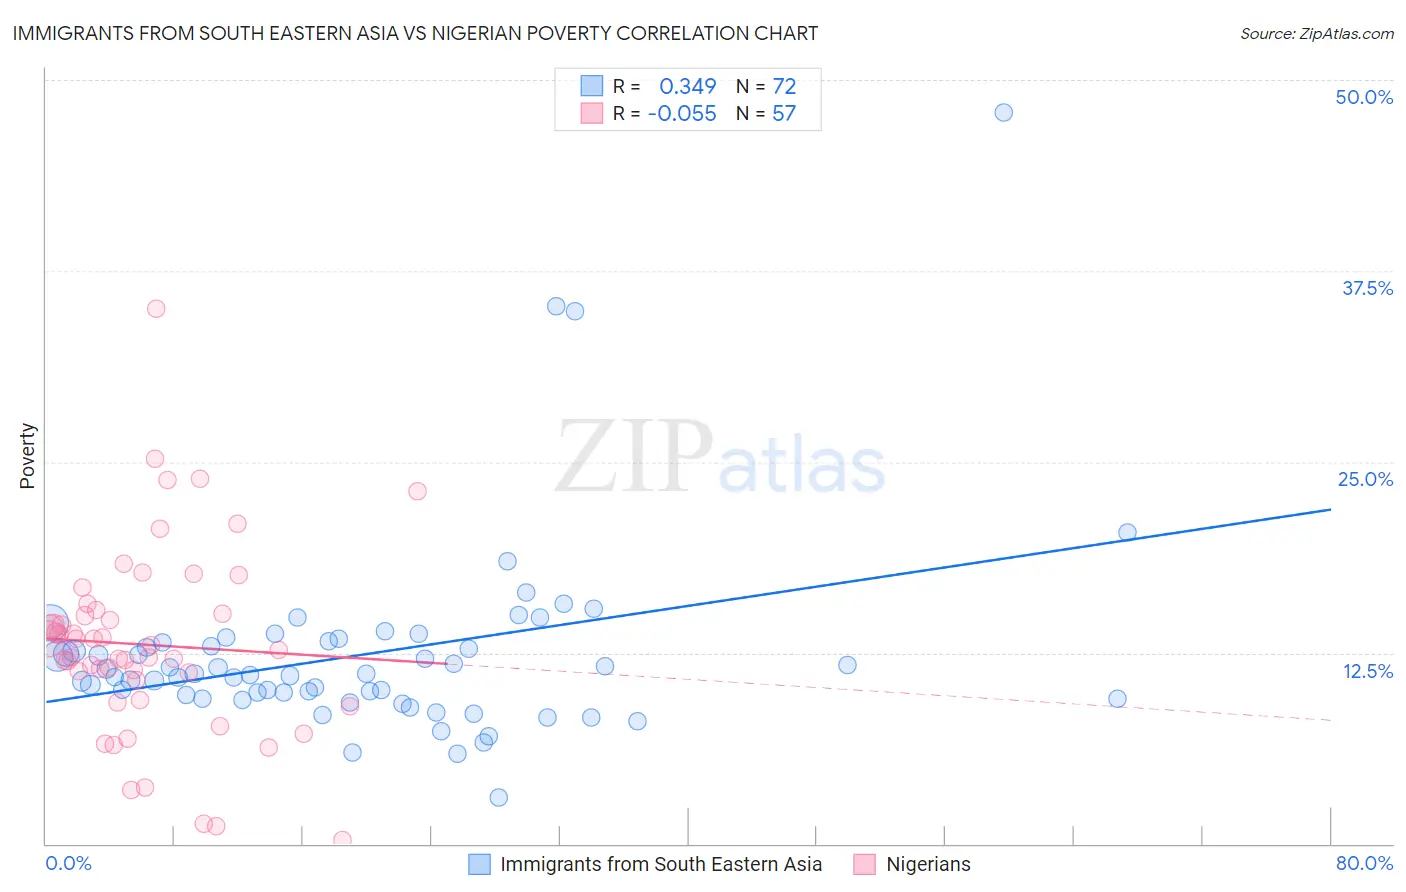
Immigrants from South Eastern Asia vs Nigerian Poverty Correlation Chart
The statistical analysis conducted on geographies consisting of 512,258,667 people shows a mild positive correlation between the proportion of Immigrants from South Eastern Asia and poverty level in the United States with a correlation coefficient (R) of 0.349 and weighted average of 11.7%. Similarly, the statistical analysis conducted on geographies consisting of 332,501,950 people shows a slight negative correlation between the proportion of Nigerians and poverty level in the United States with a correlation coefficient (R) of -0.055 and weighted average of 13.6%, a difference of 16.2%.
Poverty Correlation Summary
| Measurement | Immigrants from South Eastern Asia | Nigerian |
| Minimum | 3.0% | 0.27% |
| Maximum | 47.9% | 35.0% |
| Range | 44.9% | 34.7% |
| Mean | 12.4% | 13.0% |
| Median | 11.1% | 12.6% |
| Interquartile 25% (IQ1) | 9.6% | 10.1% |
| Interquartile 75% (IQ3) | 13.2% | 15.2% |
| Interquartile Range (IQR) | 3.6% | 5.1% |
| Standard Deviation (Sample) | 6.4% | 6.2% |
| Standard Deviation (Population) | 6.4% | 6.1% |
Similar Demographics by Poverty
Demographics Similar to Immigrants from South Eastern Asia by Poverty
In terms of poverty, the demographic groups most similar to Immigrants from South Eastern Asia are Tlingit-Haida (11.7%, a difference of 0.010%), Argentinean (11.7%, a difference of 0.050%), New Zealander (11.7%, a difference of 0.060%), Puget Sound Salish (11.7%, a difference of 0.060%), and Immigrants from Hungary (11.7%, a difference of 0.080%).
| Demographics | Rating | Rank | Poverty |
| Immigrants | Belarus | 90.8 /100 | #113 | Exceptional 11.6% |
| Immigrants | China | 90.7 /100 | #114 | Exceptional 11.6% |
| Albanians | 90.3 /100 | #115 | Exceptional 11.7% |
| Immigrants | Russia | 89.7 /100 | #116 | Excellent 11.7% |
| Sri Lankans | 89.4 /100 | #117 | Excellent 11.7% |
| Argentineans | 89.1 /100 | #118 | Excellent 11.7% |
| Tlingit-Haida | 89.0 /100 | #119 | Excellent 11.7% |
| Immigrants | South Eastern Asia | 88.9 /100 | #120 | Excellent 11.7% |
| New Zealanders | 88.7 /100 | #121 | Excellent 11.7% |
| Puget Sound Salish | 88.7 /100 | #122 | Excellent 11.7% |
| Immigrants | Hungary | 88.6 /100 | #123 | Excellent 11.7% |
| Soviet Union | 88.4 /100 | #124 | Excellent 11.7% |
| Immigrants | Brazil | 88.2 /100 | #125 | Excellent 11.7% |
| Immigrants | Norway | 88.0 /100 | #126 | Excellent 11.7% |
| Immigrants | Argentina | 88.0 /100 | #127 | Excellent 11.7% |
Demographics Similar to Nigerians by Poverty
In terms of poverty, the demographic groups most similar to Nigerians are Alaskan Athabascan (13.6%, a difference of 0.17%), Osage (13.6%, a difference of 0.22%), Immigrants from Nigeria (13.5%, a difference of 0.46%), Alaska Native (13.5%, a difference of 0.92%), and Marshallese (13.4%, a difference of 1.1%).
| Demographics | Rating | Rank | Poverty |
| Immigrants | Eritrea | 2.4 /100 | #224 | Tragic 13.4% |
| German Russians | 2.2 /100 | #225 | Tragic 13.4% |
| Marshallese | 2.2 /100 | #226 | Tragic 13.4% |
| Alaska Natives | 2.1 /100 | #227 | Tragic 13.5% |
| Immigrants | Nigeria | 1.7 /100 | #228 | Tragic 13.5% |
| Osage | 1.5 /100 | #229 | Tragic 13.6% |
| Alaskan Athabascans | 1.5 /100 | #230 | Tragic 13.6% |
| Nigerians | 1.4 /100 | #231 | Tragic 13.6% |
| Fijians | 0.8 /100 | #232 | Tragic 13.7% |
| Immigrants | Saudi Arabia | 0.8 /100 | #233 | Tragic 13.8% |
| Immigrants | Laos | 0.7 /100 | #234 | Tragic 13.8% |
| Cubans | 0.6 /100 | #235 | Tragic 13.9% |
| Immigrants | Armenia | 0.5 /100 | #236 | Tragic 13.9% |
| French American Indians | 0.5 /100 | #237 | Tragic 13.9% |
| Ghanaians | 0.5 /100 | #238 | Tragic 13.9% |