Immigrants from South Central Asia vs Mexican American Indian Child Poverty Under the Age of 5
COMPARE
Immigrants from South Central Asia
Mexican American Indian
Child Poverty Under the Age of 5
Child Poverty Under the Age of 5 Comparison
Immigrants from South Central Asia
Mexican American Indians
13.3%
CHILD POVERTY UNDER THE AGE OF 5
100.0/ 100
METRIC RATING
12th/ 347
METRIC RANK
19.9%
CHILD POVERTY UNDER THE AGE OF 5
0.3/ 100
METRIC RATING
253rd/ 347
METRIC RANK
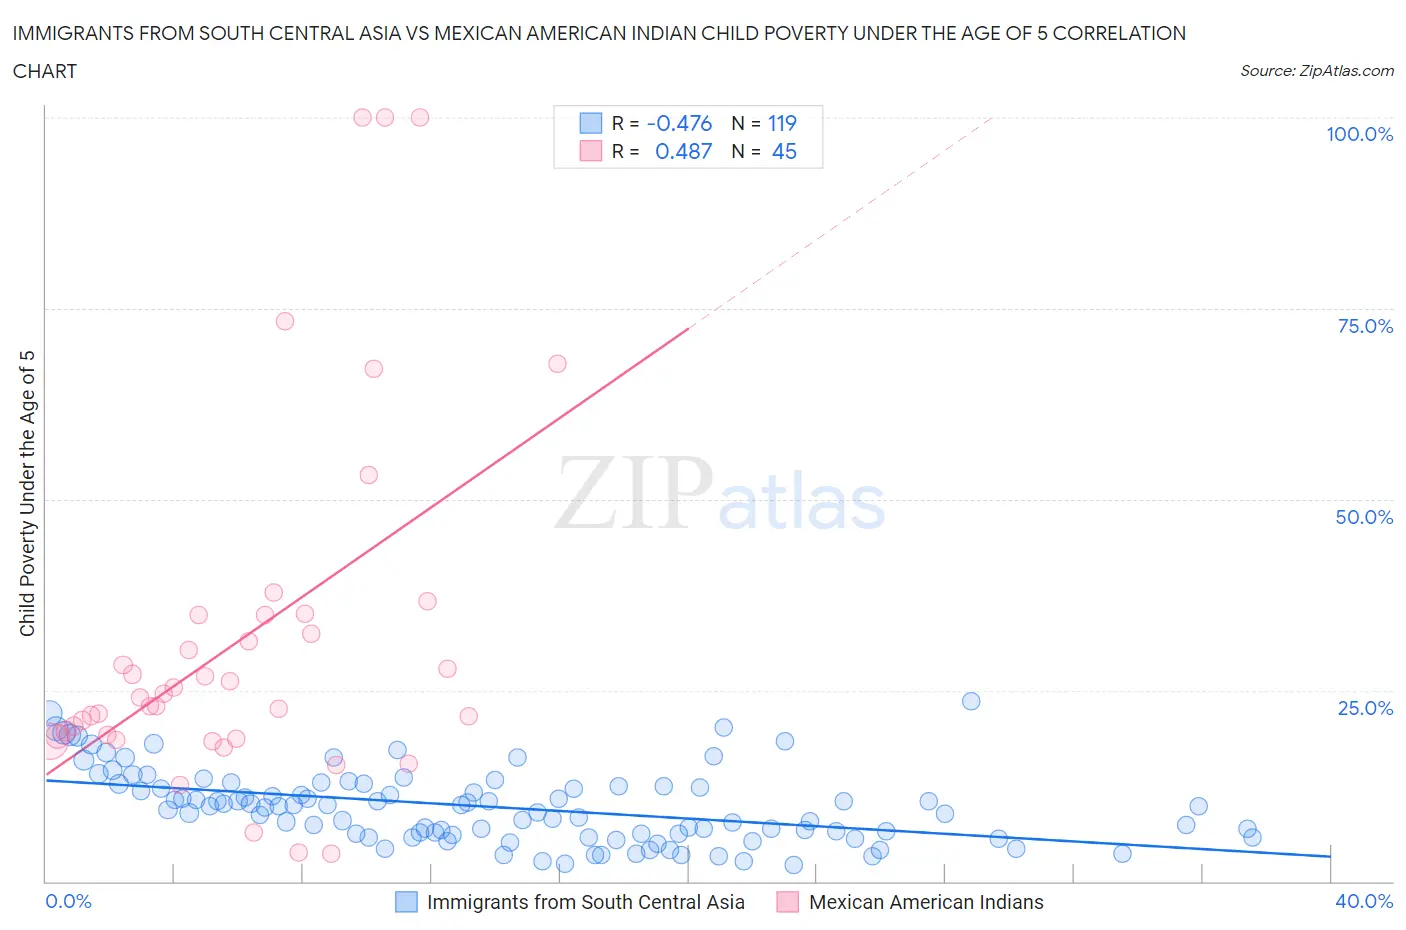
Immigrants from South Central Asia vs Mexican American Indian Child Poverty Under the Age of 5 Correlation Chart
The statistical analysis conducted on geographies consisting of 448,638,290 people shows a moderate negative correlation between the proportion of Immigrants from South Central Asia and poverty level among children under the age of 5 in the United States with a correlation coefficient (R) of -0.476 and weighted average of 13.3%. Similarly, the statistical analysis conducted on geographies consisting of 311,987,792 people shows a moderate positive correlation between the proportion of Mexican American Indians and poverty level among children under the age of 5 in the United States with a correlation coefficient (R) of 0.487 and weighted average of 19.9%, a difference of 49.9%.
Child Poverty Under the Age of 5 Correlation Summary
| Measurement | Immigrants from South Central Asia | Mexican American Indian |
| Minimum | 2.2% | 3.6% |
| Maximum | 23.5% | 100.0% |
| Range | 21.3% | 96.4% |
| Mean | 9.7% | 31.7% |
| Median | 9.7% | 24.1% |
| Interquartile 25% (IQ1) | 6.2% | 18.8% |
| Interquartile 75% (IQ3) | 12.5% | 34.9% |
| Interquartile Range (IQR) | 6.3% | 16.1% |
| Standard Deviation (Sample) | 4.7% | 23.5% |
| Standard Deviation (Population) | 4.7% | 23.3% |
Similar Demographics by Child Poverty Under the Age of 5
Demographics Similar to Immigrants from South Central Asia by Child Poverty Under the Age of 5
In terms of child poverty under the age of 5, the demographic groups most similar to Immigrants from South Central Asia are Immigrants from Korea (13.2%, a difference of 0.10%), Burmese (13.2%, a difference of 0.21%), Bhutanese (13.4%, a difference of 0.75%), Immigrants from Iran (13.1%, a difference of 1.3%), and Okinawan (13.4%, a difference of 1.4%).
| Demographics | Rating | Rank | Child Poverty Under the Age of 5 |
| Immigrants | Hong Kong | 100.0 /100 | #5 | Exceptional 12.4% |
| Immigrants | Singapore | 100.0 /100 | #6 | Exceptional 12.9% |
| Chinese | 100.0 /100 | #7 | Exceptional 13.1% |
| Iranians | 100.0 /100 | #8 | Exceptional 13.1% |
| Immigrants | Iran | 100.0 /100 | #9 | Exceptional 13.1% |
| Burmese | 100.0 /100 | #10 | Exceptional 13.2% |
| Immigrants | Korea | 100.0 /100 | #11 | Exceptional 13.2% |
| Immigrants | South Central Asia | 100.0 /100 | #12 | Exceptional 13.3% |
| Bhutanese | 100.0 /100 | #13 | Exceptional 13.4% |
| Okinawans | 100.0 /100 | #14 | Exceptional 13.4% |
| Indians (Asian) | 100.0 /100 | #15 | Exceptional 13.4% |
| Immigrants | Eastern Asia | 100.0 /100 | #16 | Exceptional 13.5% |
| Assyrians/Chaldeans/Syriacs | 100.0 /100 | #17 | Exceptional 13.6% |
| Immigrants | China | 100.0 /100 | #18 | Exceptional 13.6% |
| Immigrants | Ireland | 100.0 /100 | #19 | Exceptional 13.7% |
Demographics Similar to Mexican American Indians by Child Poverty Under the Age of 5
In terms of child poverty under the age of 5, the demographic groups most similar to Mexican American Indians are Fijian (19.9%, a difference of 0.15%), Immigrants from Cuba (19.9%, a difference of 0.25%), Immigrants from Nicaragua (19.8%, a difference of 0.44%), Immigrants from Barbados (20.0%, a difference of 0.47%), and Pennsylvania German (19.8%, a difference of 0.48%).
| Demographics | Rating | Rank | Child Poverty Under the Age of 5 |
| Cree | 0.4 /100 | #246 | Tragic 19.7% |
| Guyanese | 0.4 /100 | #247 | Tragic 19.7% |
| Marshallese | 0.4 /100 | #248 | Tragic 19.7% |
| Immigrants | Middle Africa | 0.4 /100 | #249 | Tragic 19.7% |
| Immigrants | Nonimmigrants | 0.4 /100 | #250 | Tragic 19.7% |
| Pennsylvania Germans | 0.3 /100 | #251 | Tragic 19.8% |
| Immigrants | Nicaragua | 0.3 /100 | #252 | Tragic 19.8% |
| Mexican American Indians | 0.3 /100 | #253 | Tragic 19.9% |
| Fijians | 0.3 /100 | #254 | Tragic 19.9% |
| Immigrants | Cuba | 0.2 /100 | #255 | Tragic 19.9% |
| Immigrants | Barbados | 0.2 /100 | #256 | Tragic 20.0% |
| Shoshone | 0.2 /100 | #257 | Tragic 20.0% |
| Immigrants | St. Vincent and the Grenadines | 0.2 /100 | #258 | Tragic 20.0% |
| Immigrants | El Salvador | 0.2 /100 | #259 | Tragic 20.0% |
| Spanish Americans | 0.2 /100 | #260 | Tragic 20.1% |