Immigrants from South America vs Lumbee Seniors Poverty Over the Age of 65
COMPARE
Immigrants from South America
Lumbee
Seniors Poverty Over the Age of 65
Seniors Poverty Over the Age of 65 Comparison
Immigrants from South America
Lumbee
12.7%
SENIORS POVERTY OVER THE AGE OF 65
0.1/ 100
METRIC RATING
270th/ 347
METRIC RANK
18.1%
SENIORS POVERTY OVER THE AGE OF 65
0.0/ 100
METRIC RATING
343rd/ 347
METRIC RANK
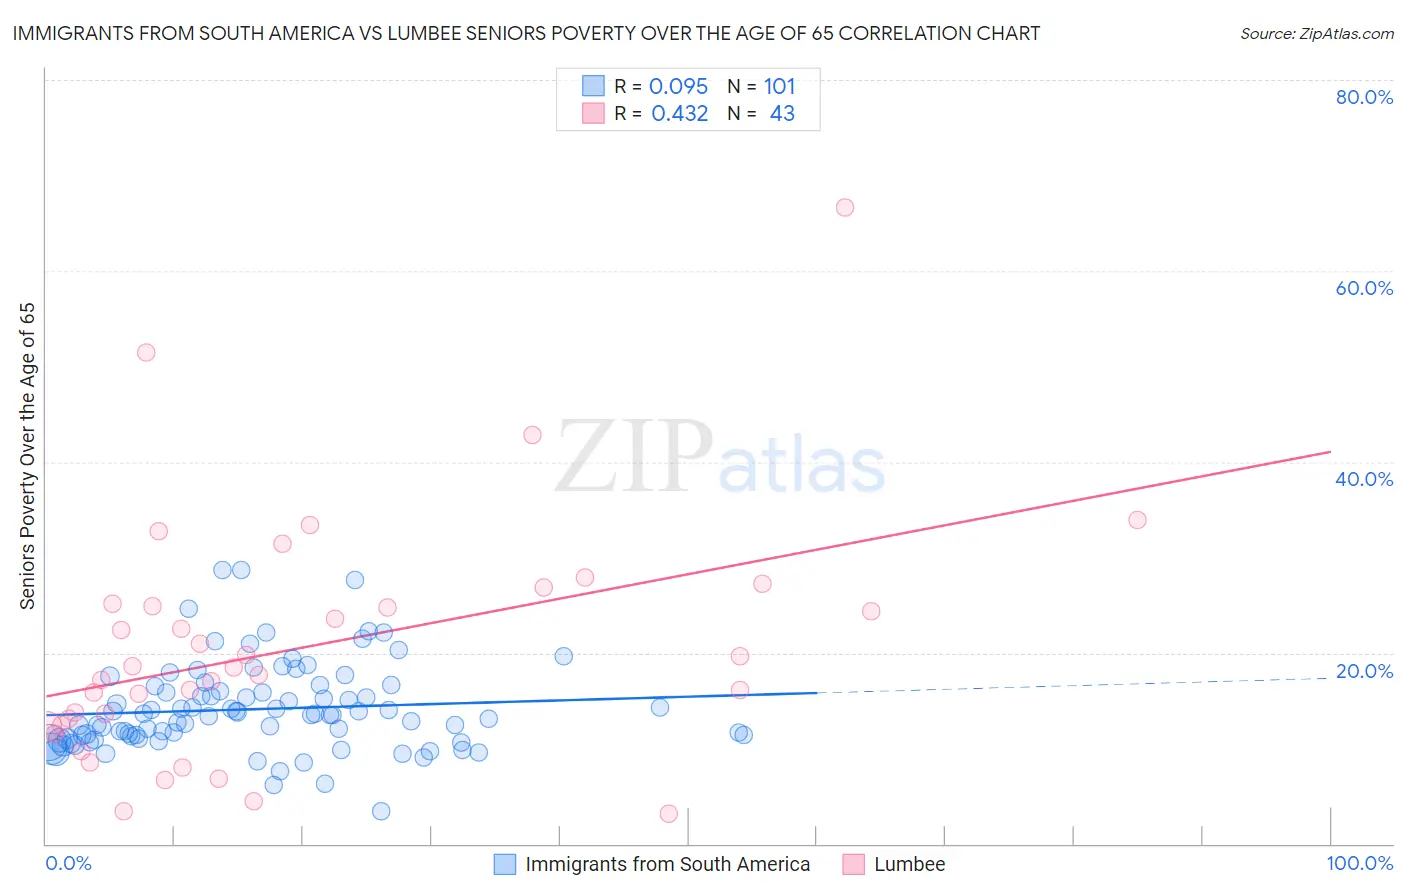
Immigrants from South America vs Lumbee Seniors Poverty Over the Age of 65 Correlation Chart
The statistical analysis conducted on geographies consisting of 483,863,368 people shows a slight positive correlation between the proportion of Immigrants from South America and poverty level among seniors over the age of 65 in the United States with a correlation coefficient (R) of 0.095 and weighted average of 12.7%. Similarly, the statistical analysis conducted on geographies consisting of 91,990,510 people shows a moderate positive correlation between the proportion of Lumbee and poverty level among seniors over the age of 65 in the United States with a correlation coefficient (R) of 0.432 and weighted average of 18.1%, a difference of 42.4%.
Seniors Poverty Over the Age of 65 Correlation Summary
| Measurement | Immigrants from South America | Lumbee |
| Minimum | 3.5% | 3.1% |
| Maximum | 28.6% | 66.7% |
| Range | 25.2% | 63.5% |
| Mean | 14.1% | 20.5% |
| Median | 13.5% | 18.5% |
| Interquartile 25% (IQ1) | 11.0% | 12.5% |
| Interquartile 75% (IQ3) | 16.2% | 25.2% |
| Interquartile Range (IQR) | 5.2% | 12.7% |
| Standard Deviation (Sample) | 4.6% | 12.5% |
| Standard Deviation (Population) | 4.6% | 12.4% |
Similar Demographics by Seniors Poverty Over the Age of 65
Demographics Similar to Immigrants from South America by Seniors Poverty Over the Age of 65
In terms of seniors poverty over the age of 65, the demographic groups most similar to Immigrants from South America are Immigrants from Venezuela (12.7%, a difference of 0.24%), Immigrants from Ghana (12.8%, a difference of 0.27%), Immigrants from Uruguay (12.8%, a difference of 0.30%), Kiowa (12.8%, a difference of 0.42%), and Salvadoran (12.8%, a difference of 0.67%).
| Demographics | Rating | Rank | Seniors Poverty Over the Age of 65 |
| Soviet Union | 0.1 /100 | #263 | Tragic 12.6% |
| Inupiat | 0.1 /100 | #264 | Tragic 12.6% |
| Immigrants | Western Africa | 0.1 /100 | #265 | Tragic 12.6% |
| Africans | 0.1 /100 | #266 | Tragic 12.6% |
| Blackfeet | 0.1 /100 | #267 | Tragic 12.6% |
| Immigrants | Somalia | 0.1 /100 | #268 | Tragic 12.6% |
| Immigrants | Venezuela | 0.1 /100 | #269 | Tragic 12.7% |
| Immigrants | South America | 0.1 /100 | #270 | Tragic 12.7% |
| Immigrants | Ghana | 0.1 /100 | #271 | Tragic 12.8% |
| Immigrants | Uruguay | 0.1 /100 | #272 | Tragic 12.8% |
| Kiowa | 0.0 /100 | #273 | Tragic 12.8% |
| Salvadorans | 0.0 /100 | #274 | Tragic 12.8% |
| Immigrants | Colombia | 0.0 /100 | #275 | Tragic 12.9% |
| Immigrants | Azores | 0.0 /100 | #276 | Tragic 12.9% |
| Paiute | 0.0 /100 | #277 | Tragic 12.9% |
Demographics Similar to Lumbee by Seniors Poverty Over the Age of 65
In terms of seniors poverty over the age of 65, the demographic groups most similar to Lumbee are Immigrants from Dominican Republic (18.3%, a difference of 0.90%), Immigrants from Cuba (17.9%, a difference of 1.1%), Dominican (17.8%, a difference of 1.6%), Hopi (17.8%, a difference of 2.0%), and Navajo (17.5%, a difference of 3.9%).
| Demographics | Rating | Rank | Seniors Poverty Over the Age of 65 |
| Immigrants | Yemen | 0.0 /100 | #333 | Tragic 15.9% |
| Immigrants | Nicaragua | 0.0 /100 | #334 | Tragic 15.9% |
| Cubans | 0.0 /100 | #335 | Tragic 16.1% |
| Immigrants | Cabo Verde | 0.0 /100 | #336 | Tragic 16.2% |
| Immigrants | Caribbean | 0.0 /100 | #337 | Tragic 16.5% |
| Pueblo | 0.0 /100 | #338 | Tragic 17.2% |
| Navajo | 0.0 /100 | #339 | Tragic 17.5% |
| Hopi | 0.0 /100 | #340 | Tragic 17.8% |
| Dominicans | 0.0 /100 | #341 | Tragic 17.8% |
| Immigrants | Cuba | 0.0 /100 | #342 | Tragic 17.9% |
| Lumbee | 0.0 /100 | #343 | Tragic 18.1% |
| Immigrants | Dominican Republic | 0.0 /100 | #344 | Tragic 18.3% |
| Pima | 0.0 /100 | #345 | Tragic 19.8% |
| Tohono O'odham | 0.0 /100 | #346 | Tragic 20.8% |
| Puerto Ricans | 0.0 /100 | #347 | Tragic 21.4% |