Immigrants from Senegal vs Immigrants from Oceania Seniors Poverty Over the Age of 75
COMPARE
Immigrants from Senegal
Immigrants from Oceania
Seniors Poverty Over the Age of 75
Seniors Poverty Over the Age of 75 Comparison
Immigrants from Senegal
Immigrants from Oceania
14.8%
SENIORS POVERTY OVER THE AGE OF 75
0.0/ 100
METRIC RATING
282nd/ 347
METRIC RANK
11.7%
SENIORS POVERTY OVER THE AGE OF 75
89.4/ 100
METRIC RATING
107th/ 347
METRIC RANK
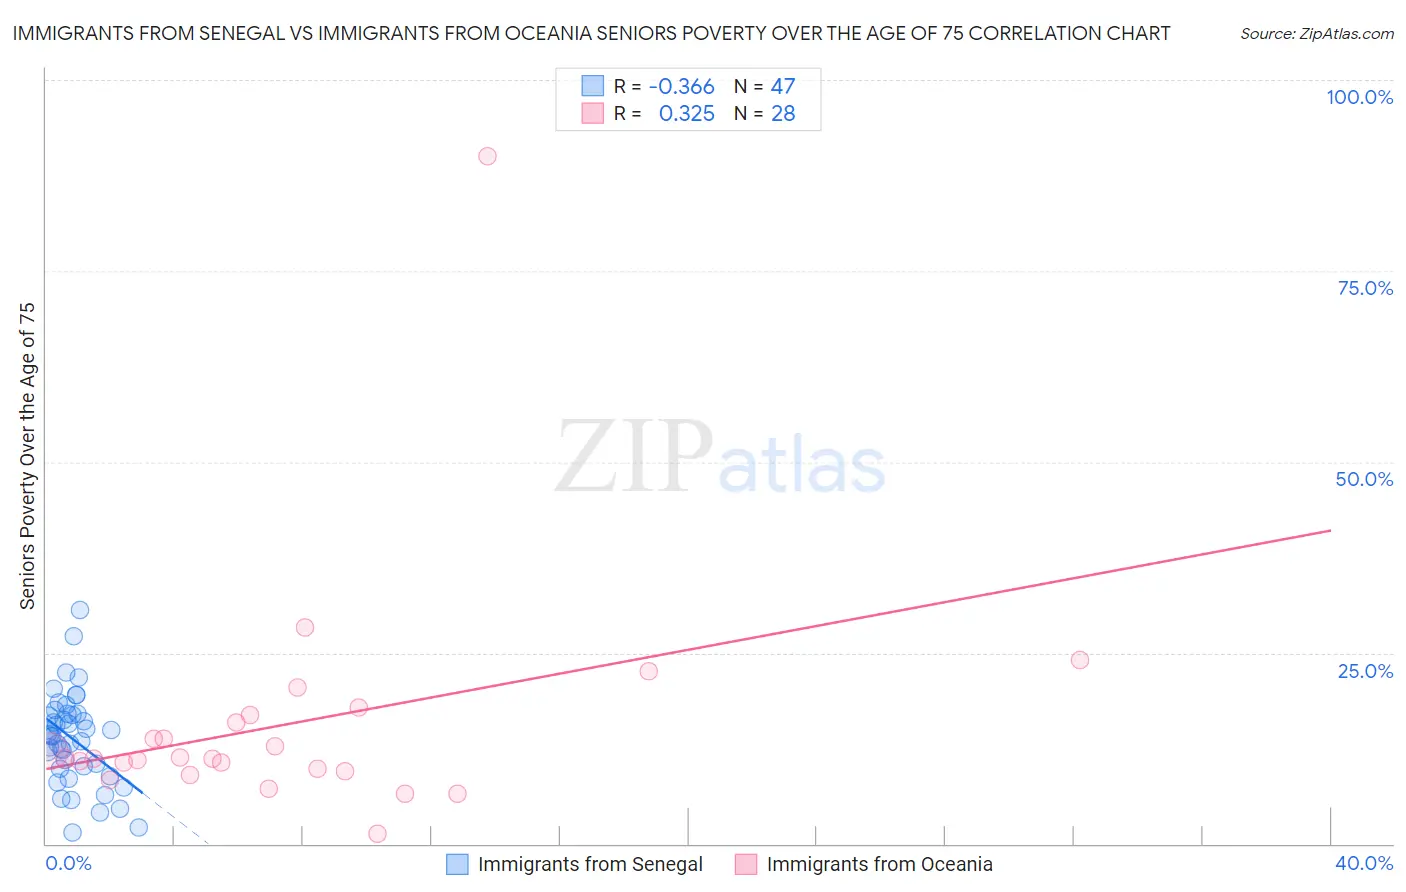
Immigrants from Senegal vs Immigrants from Oceania Seniors Poverty Over the Age of 75 Correlation Chart
The statistical analysis conducted on geographies consisting of 89,840,643 people shows a mild negative correlation between the proportion of Immigrants from Senegal and poverty level among seniors over the age of 75 in the United States with a correlation coefficient (R) of -0.366 and weighted average of 14.8%. Similarly, the statistical analysis conducted on geographies consisting of 302,239,148 people shows a mild positive correlation between the proportion of Immigrants from Oceania and poverty level among seniors over the age of 75 in the United States with a correlation coefficient (R) of 0.325 and weighted average of 11.7%, a difference of 26.8%.
Seniors Poverty Over the Age of 75 Correlation Summary
| Measurement | Immigrants from Senegal | Immigrants from Oceania |
| Minimum | 1.5% | 1.2% |
| Maximum | 30.6% | 90.0% |
| Range | 29.1% | 88.8% |
| Mean | 13.7% | 15.5% |
| Median | 14.1% | 11.1% |
| Interquartile 25% (IQ1) | 9.8% | 9.6% |
| Interquartile 75% (IQ3) | 17.1% | 16.4% |
| Interquartile Range (IQR) | 7.2% | 6.8% |
| Standard Deviation (Sample) | 6.0% | 15.7% |
| Standard Deviation (Population) | 5.9% | 15.4% |
Similar Demographics by Seniors Poverty Over the Age of 75
Demographics Similar to Immigrants from Senegal by Seniors Poverty Over the Age of 75
In terms of seniors poverty over the age of 75, the demographic groups most similar to Immigrants from Senegal are Guatemalan (14.8%, a difference of 0.060%), Belizean (14.8%, a difference of 0.18%), Central American (14.7%, a difference of 0.29%), Cheyenne (14.9%, a difference of 0.70%), and Immigrants from Mexico (14.9%, a difference of 0.89%).
| Demographics | Rating | Rank | Seniors Poverty Over the Age of 75 |
| Immigrants | El Salvador | 0.0 /100 | #275 | Tragic 14.5% |
| Soviet Union | 0.0 /100 | #276 | Tragic 14.5% |
| Senegalese | 0.0 /100 | #277 | Tragic 14.5% |
| Immigrants | Colombia | 0.0 /100 | #278 | Tragic 14.6% |
| Blacks/African Americans | 0.0 /100 | #279 | Tragic 14.6% |
| Central Americans | 0.0 /100 | #280 | Tragic 14.7% |
| Belizeans | 0.0 /100 | #281 | Tragic 14.8% |
| Immigrants | Senegal | 0.0 /100 | #282 | Tragic 14.8% |
| Guatemalans | 0.0 /100 | #283 | Tragic 14.8% |
| Cheyenne | 0.0 /100 | #284 | Tragic 14.9% |
| Immigrants | Mexico | 0.0 /100 | #285 | Tragic 14.9% |
| Immigrants | Central America | 0.0 /100 | #286 | Tragic 15.0% |
| Immigrants | Guatemala | 0.0 /100 | #287 | Tragic 15.1% |
| Jamaicans | 0.0 /100 | #288 | Tragic 15.1% |
| Immigrants | Belize | 0.0 /100 | #289 | Tragic 15.2% |
Demographics Similar to Immigrants from Oceania by Seniors Poverty Over the Age of 75
In terms of seniors poverty over the age of 75, the demographic groups most similar to Immigrants from Oceania are Turkish (11.7%, a difference of 0.010%), South African (11.7%, a difference of 0.020%), Russian (11.6%, a difference of 0.11%), Immigrants from Jordan (11.7%, a difference of 0.16%), and Burmese (11.7%, a difference of 0.16%).
| Demographics | Rating | Rank | Seniors Poverty Over the Age of 75 |
| Syrians | 91.1 /100 | #100 | Exceptional 11.6% |
| Jordanians | 90.8 /100 | #101 | Exceptional 11.6% |
| Guamanians/Chamorros | 90.6 /100 | #102 | Exceptional 11.6% |
| Immigrants | Kuwait | 90.5 /100 | #103 | Exceptional 11.6% |
| Immigrants | Singapore | 90.3 /100 | #104 | Exceptional 11.6% |
| Chickasaw | 90.2 /100 | #105 | Exceptional 11.6% |
| Russians | 89.9 /100 | #106 | Excellent 11.6% |
| Immigrants | Oceania | 89.4 /100 | #107 | Excellent 11.7% |
| Turks | 89.4 /100 | #108 | Excellent 11.7% |
| South Africans | 89.3 /100 | #109 | Excellent 11.7% |
| Immigrants | Jordan | 88.7 /100 | #110 | Excellent 11.7% |
| Burmese | 88.7 /100 | #111 | Excellent 11.7% |
| Immigrants | Bolivia | 88.4 /100 | #112 | Excellent 11.7% |
| Immigrants | Czechoslovakia | 87.0 /100 | #113 | Excellent 11.7% |
| Ukrainians | 86.9 /100 | #114 | Excellent 11.7% |